
September 2017 US CPI data 13 October 2017
- Prior 1.9%
- Core 1.7% vs 1.8% exp y/y. Prior 1.7%
- Real average weekly earnings -0.1% vs -0.3% exp m/m. Prior -0.6% prior
- Real average weekly earnings 0.6% vs 1.0% prior y/y
- Real average hourly earnings 0.7% vs 0.7% prior y/y
With this and retails, the data isn;t that bad. It’s not good enough for USD traders though who have sunk it. USDJPY trades down to 111.75.
There could be some thinking here that with CPI not as strong as expected, with the hurricanes factored in, it’s going to be much less than when they’re washed out.
Looking at the numbers, gasoline up 13.1% tells you everything you need to know.
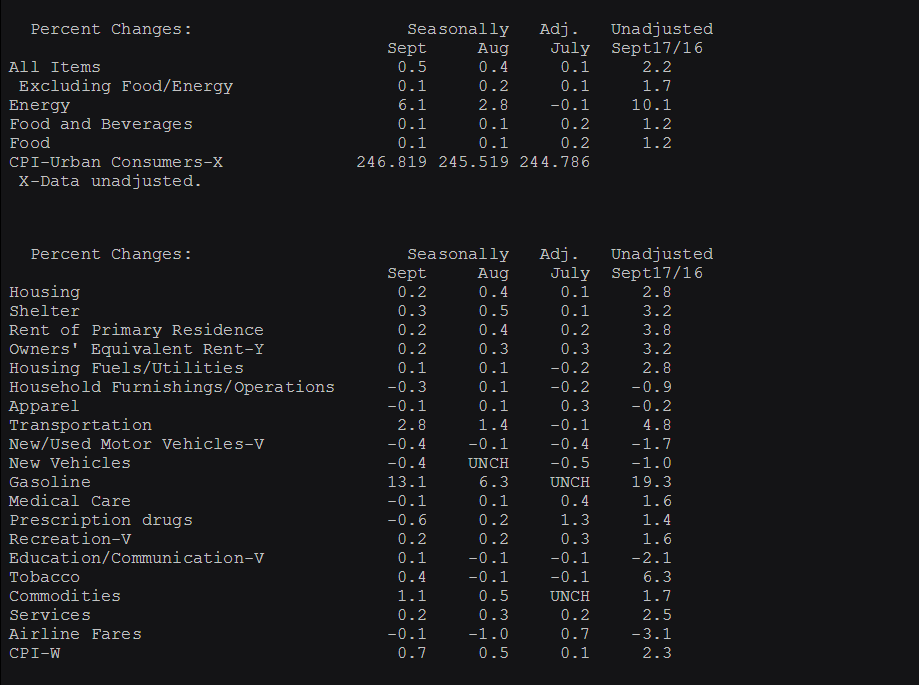
US CPI details 13 10 2017
Psychedelic chartist extraordinaire. Have your shades ready.
Philosophy: “Don’t be a Dick for a tick”
Read how Ryan got into trading here
Philosophy: “Don’t be a Dick for a tick”
Read how Ryan got into trading here
Latest posts by Ryan Littlestone (see all)
- The last NFP competition of 2022 - December 1, 2022
- Will this month’s US NFP be a horror show? - October 4, 2022
- US NFP competition – Do you think there’s going to be a turn in the US jobs market? - August 31, 2022