
AUDUSD is flirting with the recent lows
AUDUSD is looking quite interesting as it hovers around the Oct/Nov lows. 0.7625/30 is the line in the sand and a break could mean a swift move down to 0.7600 or worse.
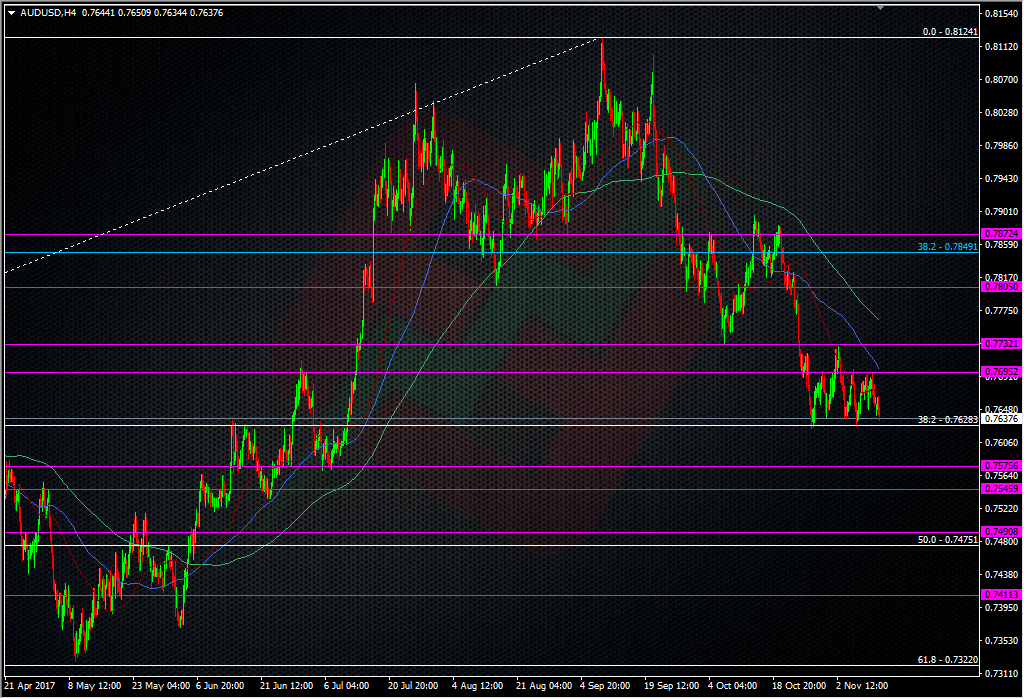
AUDUSD H4 chart
We’ll no doubt see some buying action around the 0.7600 big figure but 0.7570/80 could be more of a level.
As Friday showed us, there’s decent selling into 0.7690/0.7700 and with the 200 dma sitting there too, it’s looking strong up there.
It looks like there’s a good opportunity to trade the 0.7630 level down here. If I was looking at longs, I’d get in close to 0.7630 with a tight stop under 0.7620. For shorts, a break (and confirmation) of 0.7620 would aim for 0.7600. Again a tight stop above 0.7630 or 40 would lower the loss risk from a fake break.
I am tempted by a long down here but it’s looking quite heavy at this moment, so that raises the chances of a downside break.
It’s pretty much the same picture across all the main FX pairs at the moment. We’re testing/breaking these intraday and short-term tehc levels without really going anywhere. Keeping trades on a tight lead and not getting married to, or guessing a direction is the best play right now, as my colleague H also noted earlier.
Philosophy: “Don’t be a Dick for a tick”
Read how Ryan got into trading here
- The last NFP competition of 2022 - December 1, 2022
- Will this month’s US NFP be a horror show? - October 4, 2022
- US NFP competition – Do you think there’s going to be a turn in the US jobs market? - August 31, 2022
The past week I went long around 0.763, then closed around 0.768. Now long again. Stop close, ranging big time 0.7625/0.772
Not sure the mkt has fully digested the change in RBA forecasting of the past week, let’s see if it breaks either side, in case ready to go with it. Though I think even in that case the range would not extend a lot, there should be hard work to do through 0.75s
Nice trade mate. It was looking very heavy yesterday and I wasn’t surprised to see the move down to 0.7600 after the break of 0.7630.