
October 2017 UK inflation data 14 November 2017
CPI
- 0.1% vs 0.2% exp m/m. Prior 0.3%
- Core CPI 2.7% vs 2.8% exp y/y. Prior 2.7%
- 0.0% vs 0.3% exp m/m. Prior 0.2%
- CPIH 2.8% vs 2.9% exp y/y. Prior 2.8%
RPI
- 4.0% vs 4.1% exp y/y. Prior 3.9%
- 0.1% vs 0.2% exp m/m. Prior 0.1%
- Ex-mortgage payments 4.2% vs 4.1% prior y/y
- 0.1% vs 0.1% prior m/m
PPI
- Input prices 4.8% vs 4.8% exp y/y. Prior 8.4%
- 1.0% vs 1.1% exp m/m. Prior 0.4%
- Output prices 2.8% vs 2.9% exp y/y. Prior 3.3%
- 0.2% vs 0.3% exp m/m. Prior 0.2%
HPI (Sep 2017)
- 5.4% vs 5.0% prior y/y
On a first look it’s all pretty much either a tad soft or unchanged. CPI hasn’t fallen so it maintains the “peak” aspect for the BOE. GBPUSD fell to 1.3073 and trades at 1.3081. There’s certainly nothing here to send the pound higher but neither is there much to send it meaningfully lower.
From the ONS;
- Rising food prices offset by a drop in cost of fuel; petrol prices fell 0.9p in October
- Pace of raw material cost growth slowing; crude oil and petrol rising less than year-ago
- Imported material prices (4.0%) lowest since Jun 2016 (0.6%)
- PPI input prices slow as base effects play out
- RPI and RPI-Ex annula rates highest since Dec 2011
- UK has seen higher goods prices than EU over the last 6-months
- House prices rise in Sep, property prices in NW and SW England rose strongly

UK CPI details
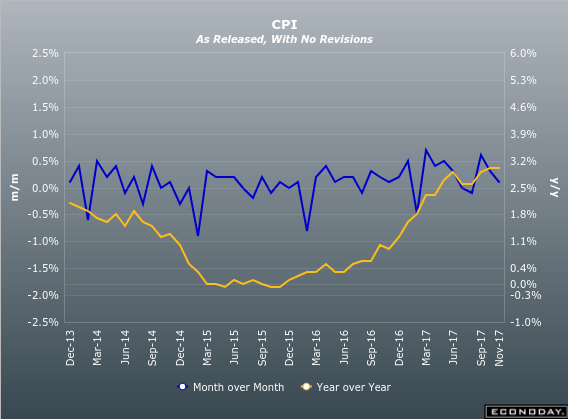
UK CPI m/m y/y
Psychedelic chartist extraordinaire. Have your shades ready.
Philosophy: “Don’t be a Dick for a tick”
Read how Ryan got into trading here
Philosophy: “Don’t be a Dick for a tick”
Read how Ryan got into trading here
Latest posts by Ryan Littlestone (see all)
- The last NFP competition of 2022 - December 1, 2022
- Will this month’s US NFP be a horror show? - October 4, 2022
- US NFP competition – Do you think there’s going to be a turn in the US jobs market? - August 31, 2022