
The USD story continues into 2018
After a blistering run in stocks and to a certain extent, Treasuries in 2017, we cannot blame thin markets for the demise of the Greenback. It remains to be seen, but Uncle Sam`s USD seems set for a lacklustre 2018, or does it?
As FX traders, we attempt to judge the likely flows each and every day, attempting to position ourselves “right-side of the markets”. Not by any means easy FX-folks. How did the USD attract flows during 2017? Principally through the “Trump trade”, Treasuries, stocks and high yield corporate debt. Those 3 elements were the main protagonists. Treasuries for backbone safety/yield, stocks for safety and higher yield and corporate debt (the risky stuff) for tasty high yields. Can it change?
The Trump trade is all but done with only infrastructure plans to come as a potential driver. Infrastructure plans are at risk because the Trump administration need inward investment to fund the railways improvements, roads, bridges, airports and so on. Can an inward looking USA tempt the inward investment? I believe they will fall short. Now that Obamacare savings are all but gone and the Tax plan seems to have fallen well short of expectations (according to many analysts), infrastructure of the scope that Trump promised during his campaign seems totally reliant upon inward investment. To an inward looking, protectionist US administration? Questionable at best.
First week of 2018. Will we see a “sell the good news Trump trade”? Are we indeed already seeing a sell the fact? Is this sell the USD story really due to thin-holiday markets or are we about to see serious profit taking on US stocks, corporate debt and treasuries and a rotation into Emerging markets? 2017 was a year of serious geopolitical woes. Most of those woes seem all but solved with North Korea at stalemate, Europe with just Italian elections to negotiate, Brexit worries abated to a certain extent while the much needed transition period is negotiated before trade talks. The USD has to negotiate the expectations surrounding mid-term elections, which don`t look good for the Republicans and beleaguered Trump administration.
All-in-all, a rotation looks likely Rotation into carry, high yielding EM`s, metals and soft commodities, oil, gas and of course Europe-wide where the recovery looks a genuine recovery for a change. Japan`s economy is doing well. Is it time for World money managers to rotate somewhat away from US safety and lay their bets elsewhere? Let`s see!
Looking at the Dollar Index (DXY) chart for today, we can see on the daily chart that major trend-line resistance 93.85 from the joining of 102.97 and 101.26. We have been watching this over the few weeks prior to the holidays and our first crack was breaking the major trend-line support at 93. DXY declined to 92/91.02, negating the much needed jump to 93.85 to halt the slide. No jump.
It became a sell the rallies and CFD traders such as myself, headed for 91.60 to TP. We got that.
Supports to break now come in at 91.39/91.22 and the line in the sand is psychological 91`s. Break there and we are likely spilling into the 80`s and 2015 levels. We have to consider continuing to sell the rallies.
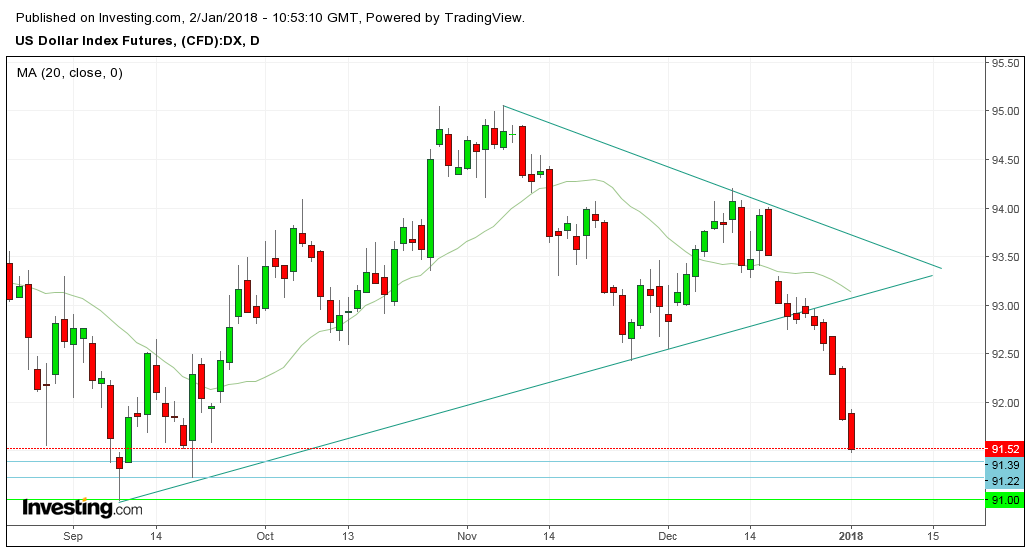
DXY daily chart

- Why is the Buck so strong? - May 2, 2018
- What have we on the board today? - April 18, 2018
- A time-tested strategy for account management - March 19, 2018