
I like the look of yesterdays price action and the bounce has held in the Asia session.
We stopped just short of the barrier option at 110.00 and 61.8% of the September 2017 low – November highs before breaking up through a small Inverse Head and Shoulder pattern (blue trendline) to halt around the 61.8% fib (yellow area) of this months swing low. Buyers and profit takers were quick to respond, resulting in a counter move higher for the pair.
A break and hold above the 61.8% will open up the more important 38.2% of the larger Sept – Nov swing along with the 50% of the more recent swing low (upper blue area on chart).
We could expect to see some consolidation here, which would be healthy from a bullish perspective and I’m not ready to jump in long just yet………….I would like to see a push through the near term highs (61,8 yellow level) above 111.50 to get long. Alternatively a bounce from lower levels towards the blue trendline accompanied by some bullish candle action on the hourly. The weekly candle is bullish if we were to hold at these levels or higher. yet with two trading days to go it would be a tad premature to rely on that particular indication .
Large options in play today – 110.80 (USD 1.5bn) — 111.00-05 (USD 1.5bn). Could pin price before NY trading .
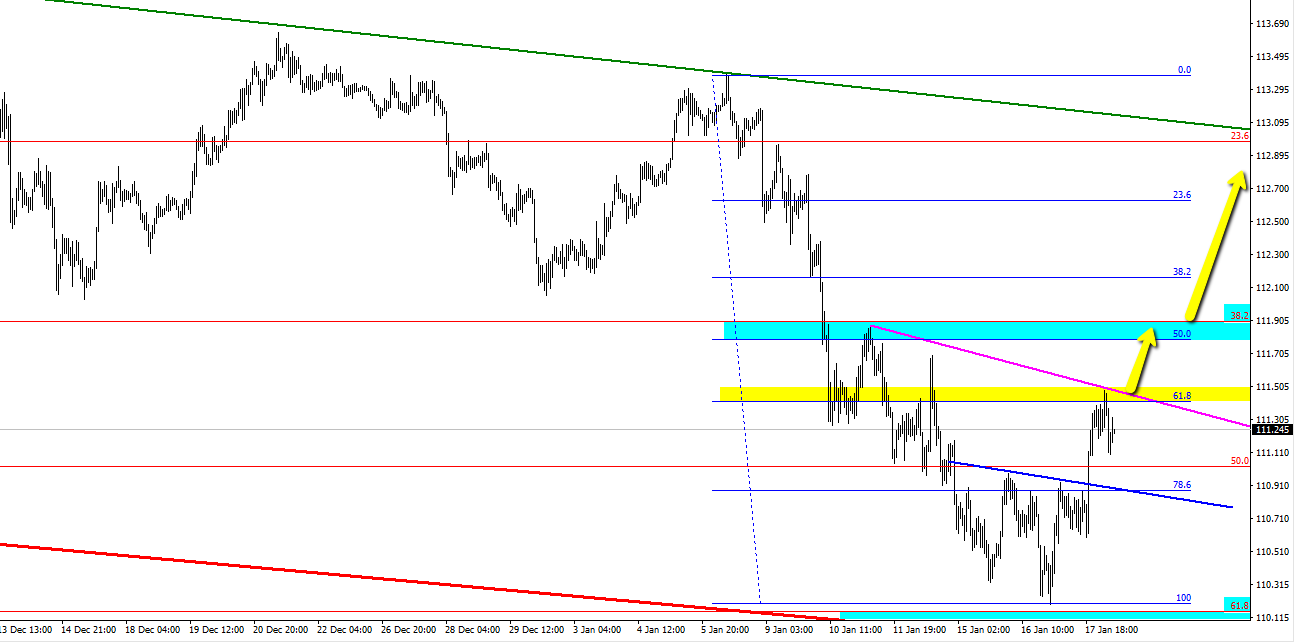
USDJPY 1 Hour

Philosophy: "Trading rules.....it most certainly does"
Read how Horatio got into trading here
- Silver – This weeks shining star, as predicted by ForexFlow - July 19, 2019
- 新年快乐 财源滚滚 大吉大利 A Happy wealthy healthy New Year to all our Chinese friends - February 4, 2019
- Gold and Silver – Glittering prizes? - January 28, 2019
guppy looking bullish now, can you show me your TA on this pair?