
Relatively well behaved and a little bogged down of late due to both spot prices rising in strong uptrends
AUDNZD finds itself caught in a falling wedge. The pattern has a higher chance of producing a bullish outcome in the long run, yet frustrating to trade as it bounces around within the trendlines.
Wedges are often mistaken for triangles or pennants – In the case of a falling wedge we need to see lower lows and lower highs within a contracting range. They tend to work much better on charts viewed on an Hourly timeframe or above
I’ve been playing / daytrading the edges on this one and now looking for a possible break, or another turn lower as we approach the top of the pattern……The longer term chart below shows the situation of the wedge relative to the price action.
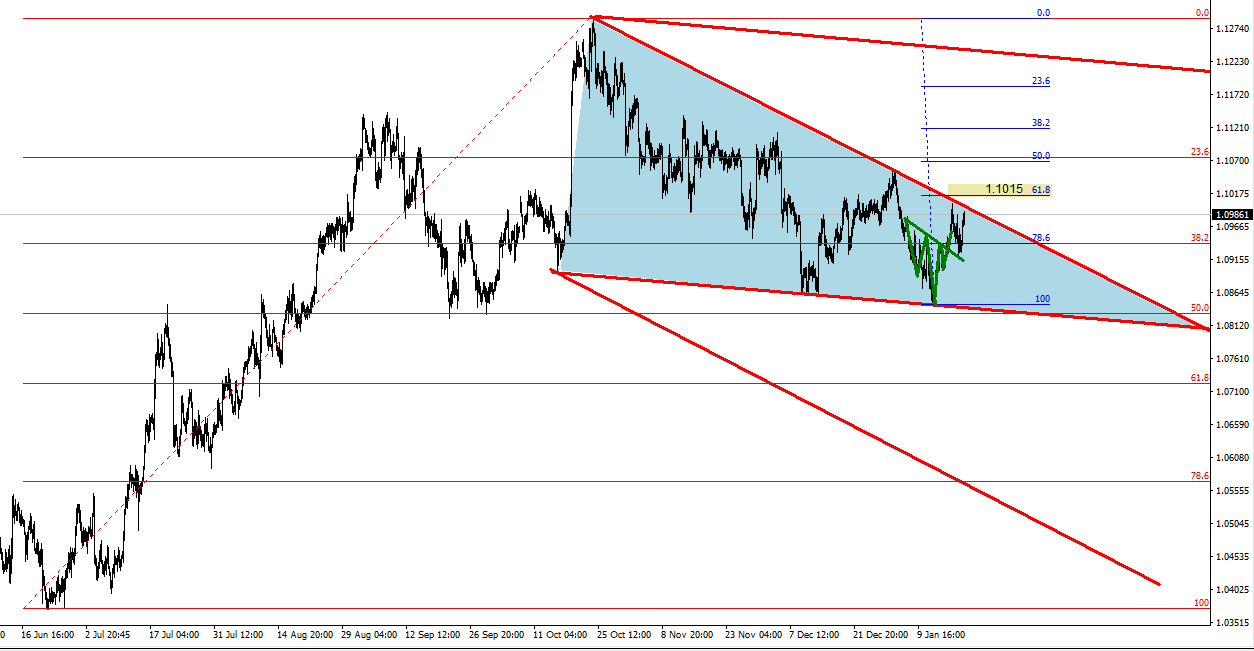
AUDNZD 4 Hour
A few decent trading opportunities were taken from what at first glance seems a rather boring and mundane chart. A break out and up towards the 61.8% fib from the late October highs to January low is what’s needed to set this one alight .
A move out of the pattern and an attack on the 1.1015 area will have me adding to my long exposure .
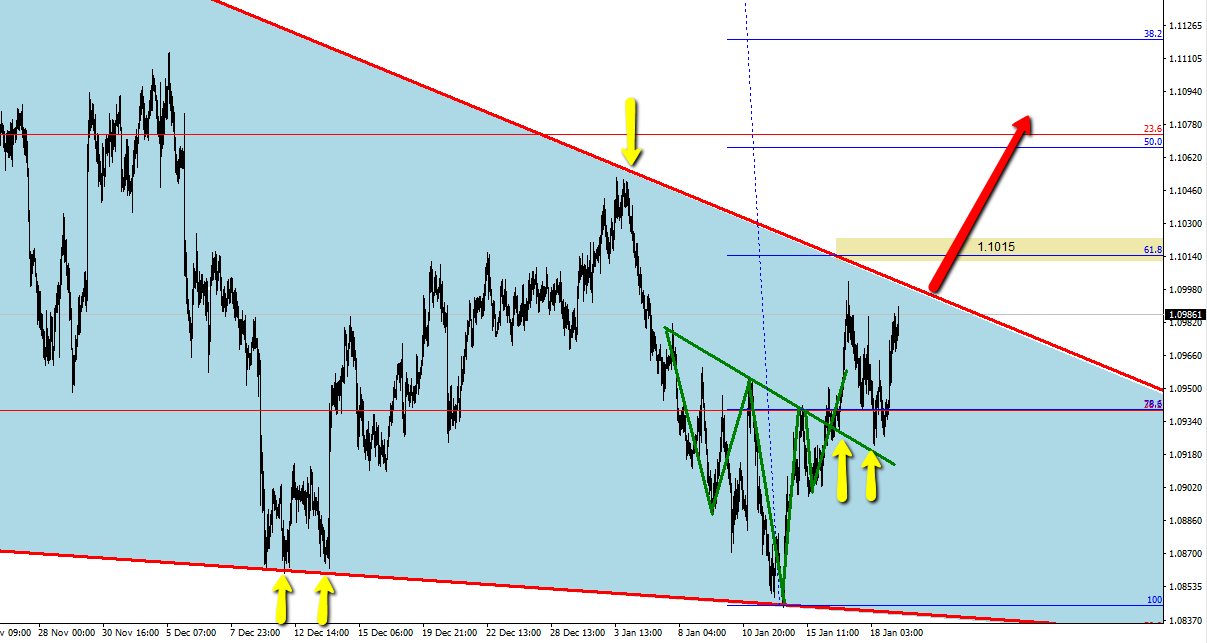
AUDNZD 1 Hour

Philosophy: "Trading rules.....it most certainly does"
Read how Horatio got into trading here
- Silver – This weeks shining star, as predicted by ForexFlow - July 19, 2019
- 新年快乐 财源滚滚 大吉大利 A Happy wealthy healthy New Year to all our Chinese friends - February 4, 2019
- Gold and Silver – Glittering prizes? - January 28, 2019