The 1.40 break in GBPUSD looked good but now we’ve gone into reverse
1.3963 has just traded after we touched a high of 1.4027, in what is looking like a proper fake out and stop run.
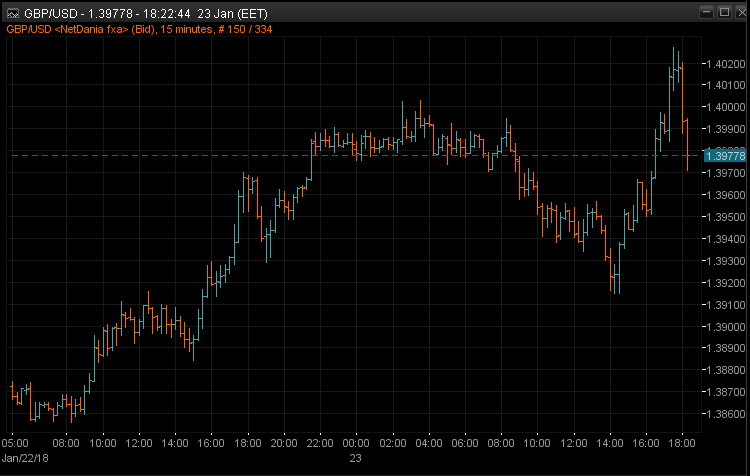
GBPUSD 15m chart
There’s a reason traders need to know how price action works around big levels like these so we can protect ourselves as much as possible. I went with the break with a buy stop at 1.4006 and took half off at 1.4020. The balance I ended up chopping out at 1.3999. Overall, 7 pips made (+14 on half, -7 on half). Not massive but there’s was only two things that could have happened. The rally held a test of 1.40 and pushed on, or it failed and collapsed. My job isn’t to guess what might happen, my job is to protect my trade, protect my profits when in the money and restrict my possible losses.
From here, and given the size of the rejection so far, we can expect fresh resistance to build into 1.40 again. Failing that, we could find the price just flip flopping around 1.40 for a while before we get the next direction. Support may have also re-established itself around 1.3950/55, otherwise the 1.3916 level is the one to watch again. Trading wise, the picture might become a little muddy here so I’m going to sit back until it’s clearer.
It looks like a big part of the break was down to the jump in Brent oil through $70. That was matched with commodity FX seeing gains too (of which GBP is one (when it wants to be)).
I’m still sensing trouble brewing for the 110 level in USDJPY so that might be the next show to watch.
Philosophy: “Don’t be a Dick for a tick”
Read how Ryan got into trading here
- The last NFP competition of 2022 - December 1, 2022
- Will this month’s US NFP be a horror show? - October 4, 2022
- US NFP competition – Do you think there’s going to be a turn in the US jobs market? - August 31, 2022