
One that has been on my radar for a while. Sometimes these longer term fib levels catch a good swing.
Watching this for a few days and managing to confuse myself regarding the fundamental pros and cons for attempting a long trade around here. Price seems to be staling and taking a breath. The drop so far this year has been an impressive one for those lucky short side traders.
The fib in question is the 50% from the lows way back in January 2016 to the highs of mid November last year. Price has been hanging around the level this week without much indication of a bounce so far. – So this is going to be a step into the unknown with established trend firmly against me. I opened a feeler long position at the time of writing at 0.7387 . I’ve placed a wide stop beneath the lows as I’m wishing for more of a medium term trade rather than an intraday scalp.
A quick look at the H4 chart below shows a few recent hammer candles in the downtrend. This could signify a willingness to challenge the drop from here without too much success, yet enough for me to stick my oars in and tackle the tide .
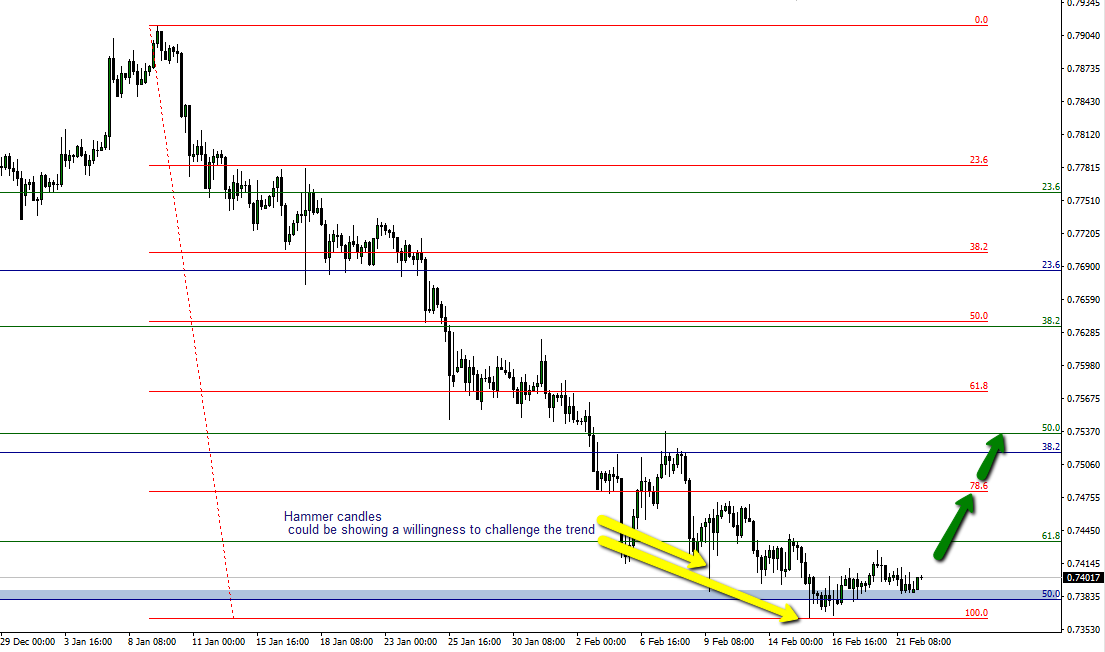
CADCHF H4
The Daily chart below shows the full extent of the damage inficted by the wave down since the end of 2017

CADCHF Daily chart

Philosophy: "Trading rules.....it most certainly does"
Read how Horatio got into trading here
- Silver – This weeks shining star, as predicted by ForexFlow - July 19, 2019
- 新年快乐 财源滚滚 大吉大利 A Happy wealthy healthy New Year to all our Chinese friends - February 4, 2019
- Gold and Silver – Glittering prizes? - January 28, 2019
Hello Horatio! It’s quite like the eurcad trade. I have been selling since we have been having some tops and closed the positions various times with some pips. Looking to resell but it’s not moving a lot, it seems that cad is very weak.
Something is worrying me and it’s the core retail sales. So I’d prefer to wait this afternoon and then entry or fade the move.
That EURCAD has been a real ugly monster to try and short LOL ….So I feel your pain Stephane
I see some downside imminent …..Maybe I have to change my spectacles and eat more foie gras and relax a bit more 🙂
Lol with the foie gras, just in Christmas time 😉
Hi Dubsy nice picture of your yacht 🙂 . You are a master tactician like your famous wave farer namesake but it did cost him various bits along the way though ;). atvb Chris
He was a bit of a lad wasn’t he Chris 🙂
He changed the battle formation from broadside attack to sailing the fleet at 90 degrees and gunning for the mainsails head on .
West Ham could have learned a thing or two 🙂
Yep he was he wanted a conclusive win and calculatedly gambled . It payed off big time as he lost none and took 22 French and Spanish. The French commander who was due to be replaced lset sail before he could as he knew it was coming and was going to take a gamble himself with a line of 3 but backed out and order his ships back to conventual one line. The rest is history and fine lines Dubsy atvb Chris
I’m holding on by the skin of my jolly rogers on this one
See if we stabilise around the 0.7350’s otherwise it’s a dud
In this case, I prefer my recent eurcad short 😉 let’s see!
I’m itching to tame that Tiger Stephane
Trying to figure a short entry …It’s a monster as I said previously
1.5710 should be the next high…. and yap a big monster 😉 and a funny one when it works!
AUDCAD is worth watching for shorts at this level
Around the big BIG fig
Decided to go long with U since 0.7340 :;)
You got a better entry than me ?
I’m not talking to you anymore Stephane 🙂
The CPI data should help. I bought a little more before the data with a tight stop ( moved to entry now )