
January 2018 US FHFA HPI 22 March 2018
- Prior 0.3%. Revised to 0.4%
- 7.3% vs 6.5% prior y/y
Yesterday Fed’s Powell said they’re not seeing any bubbles in house price but this y/y indicator is edging up to pre-crisis highs. The all time high for the FHFA was some 10.5% in 2005. The post crisis high was 7.8% in Jul 2013. What’s keeping it from being really bubbly is that house prices have risen slowly and steadily rather than fast.
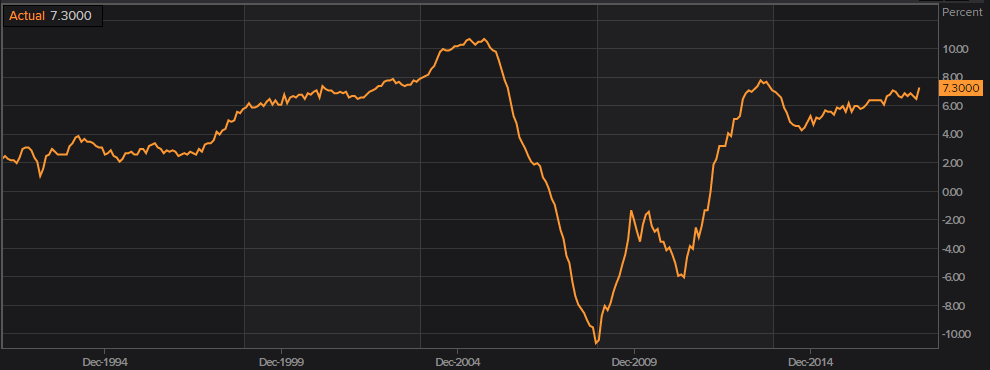
US FHFA HPI yy
Psychedelic chartist extraordinaire. Have your shades ready.
Philosophy: “Don’t be a Dick for a tick”
Read how Ryan got into trading here
Philosophy: “Don’t be a Dick for a tick”
Read how Ryan got into trading here
Latest posts by Ryan Littlestone (see all)
- The last NFP competition of 2022 - December 1, 2022
- Will this month’s US NFP be a horror show? - October 4, 2022
- US NFP competition – Do you think there’s going to be a turn in the US jobs market? - August 31, 2022