The bounce in EURUSD has many traders confused about the next direction. Here’s how you can eliminate most of the guesswork on what happens next
When you’re running with or following a strong trend, it’s hard to believe it can ever end. But trends do, and prices change, so how can we really know whether we’re seeing a pause or a reversal in the trend? When trends pause it can cause confusion for many traders. Reversals can be blips or lead to something bigger. Traders start second guessing themselves as to whether they should stay in, get out or go the other way. It can be a dangerous time because when something that worked well stops working, it can be hard to identify that change for what it really is.
That’s exactly what’s happening in EURUSD. A strong fall has now seen its biggest bounce so far, and traders are concerned about what happens next. The reality is that anything can happen. We could go back down, we could go further up. To help mitigate the confusion, traders that followed the trend down, should have been noting levels on the way down that would/could be significant for them if it went back up. These levels are important because they can define whether the trend remains or is starting to breakdown. For today, one such level is up at 1.1725/30, a level we’ve noted previously. For some reason the 1.1930, 1.1830, & 1.1730 levels became resistance after breaking through. These were the bigger stand out levels in bounces at the time, and so they can become so again. Today, EURUSD has made a high of 1.1724, Right into that area. Just to make it visual, I’ve noted tthe 30’s on the chart below.
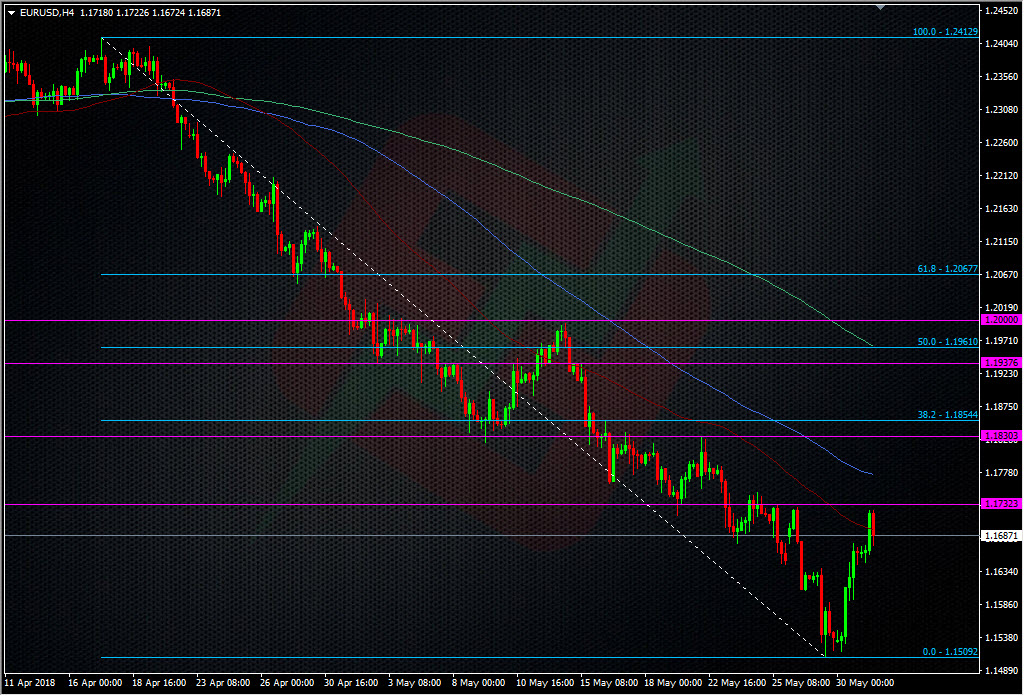
EURUSD H4 chart
These are the sorts of levels that can define whether a trend is changing or not. In this case, that’s where we’ve found a potentially strong top, though who knows whether it will last or not? That’s not the point though. The point is that it’s an area for traders to watch. It’s one for longs from below to judge and one for shorts higher up to judge. It gives opportunities to take profit for both longs and shorts and to add to exisiting positions (for shorts if it holds, and longs if it breaks). It gives news trades for others. Shorts can try a low risk trade against it with a very tight stop. If it holds and the trend resumes, they’re on to a good trade. If it breaks, the damage is small. This is what trading is. It’s not about guessing what might happen next, it’s about letting the charts do the talking. We’ve one single area 1.1725/30 and we only have to trade whether the price stays below or goes above. It’s a simple question with only two answers, yes it breaks, no it holds.
There’s also another great way to judge the state of a trend and that’s with fibs. Fibs are very important to me because they show me what the price has to do to break a trend.
How do I use them for that?
The fibs offer a view of what a price has to do to reverse or break a trend. The 38.2 is a warning for traders that the trend is facing trouble. The 50.0 fib is where traders who ran with the trend have a big decision to make. That’s 50% off their trend reversed and that can’t be ignored. In most cases, if we hold either of those levels, traders will jump back into the trend and push it back the way it was going. If the 38.2 breaks, we can see some partial profit taking, and even more if the 50 breaks. The 61.8 is the usually the final line for those left in the trend and a break there will see those long held positions exited. Trend over. Now, like all tech, there’s no guarantees but as I say, for me it’s a guide showing me where something may happen to change or reinforce a trend.
Now, back to the chart above. The 38.2 fib of this downtrend is at 1.1855. That’s still a world away from where we are now. So, that tells me that there’s still a lot to be done before even thinking about seeing the downtrend change. If we can’t get close to that level, the trend remains and we face further downside. That now gives me a bigger level to watch and a trading spot that I can perhaps go in with bigger risk with. Now I have the minor levels to watch for intraday trading (the 1.1725/30 today) with small low risk trades, and a bigger level to go with larger risk trades (conditions at the time to be judged). I’ve a bag full of trading opportunities now but do you know the most important point? I haven’t made any guesses on what the price might do. I’ve no confusion about the moves going on, the reasons why or what may or may not happen. I’ve picked levels where something might happen and can trade them as they come. I don’t care about the trend or the direction, I have no emotion in it, I just care about how I trade the levels I’ve identifed.
But there’s even more.
Traders need to be aware of all the trends in play. While this drop in EURUSD is the main attraction now, we can’t ignore that it’s part of a bigger trend in play, and that’s the uptrend since 2017. So, again, we use our fibs to marry the two together.
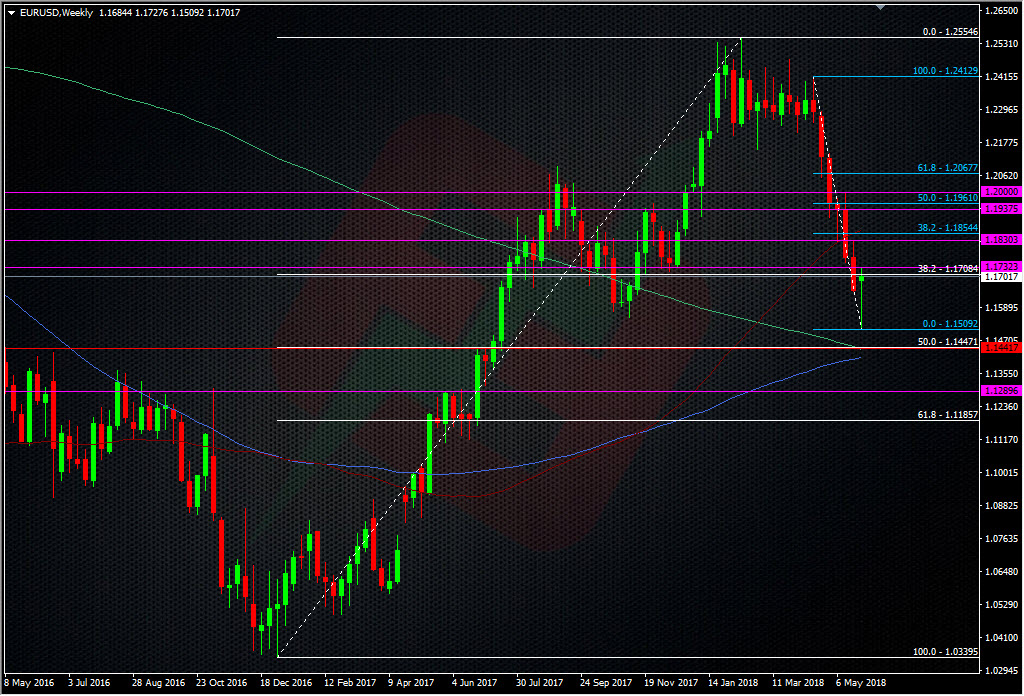
EURUSD weekly chart
In my previous analysis, I noted that I favoured the 1.1440/50 area for longs. The chart above shows why. There’s two big MA’s and the 38.2 fib of the 2017 move. That’s some big potential support for the uptrend and could be the deciding factor for the shorter-term downtrend. All these levels give traders a choice, whether they are in trades or looking for fresh trades. By sheer size alone, the uptrend is a much bigger and a potentially stronger trend than the recent downtrend, and in most cases, that trend will swamp the smaller trend. But, as you can see, we didn’t get to the 38.2 fib so long-term longs have gained confidence and pushed the price away, much to the disappointment of shorts on the downtrend. Had we tested and broken the 38.2 fib, that could have accelerated the downtrend as shorts pushed with the break as some longs folded. It’s all fun and games isn’t it?
Once again, we use the tech to our advantage and to take the guess work out of our decisions. We can remove any emotional attachment to our positions. We don’t need to find ourselves confused by moves, we can just sit back with a few highlighted levels on our charts and trade them as they come. The biggest problems for most traders is that they allow emotions and confusion to guide them instead of taking a breath, stepping and looking for what is clear and simple in front of them. Either trend may carry on or die and none of us knows which it will be but we don’t need to, as we have the places to watch and trade it.
Philosophy: “Don’t be a Dick for a tick”
Read how Ryan got into trading here
- The last NFP competition of 2022 - December 1, 2022
- Will this month’s US NFP be a horror show? - October 4, 2022
- US NFP competition – Do you think there’s going to be a turn in the US jobs market? - August 31, 2022
Fantastic piece Ryan. It is incredible how much I learn from reading your posts!
Christian
Wow, thank you very much Christian.