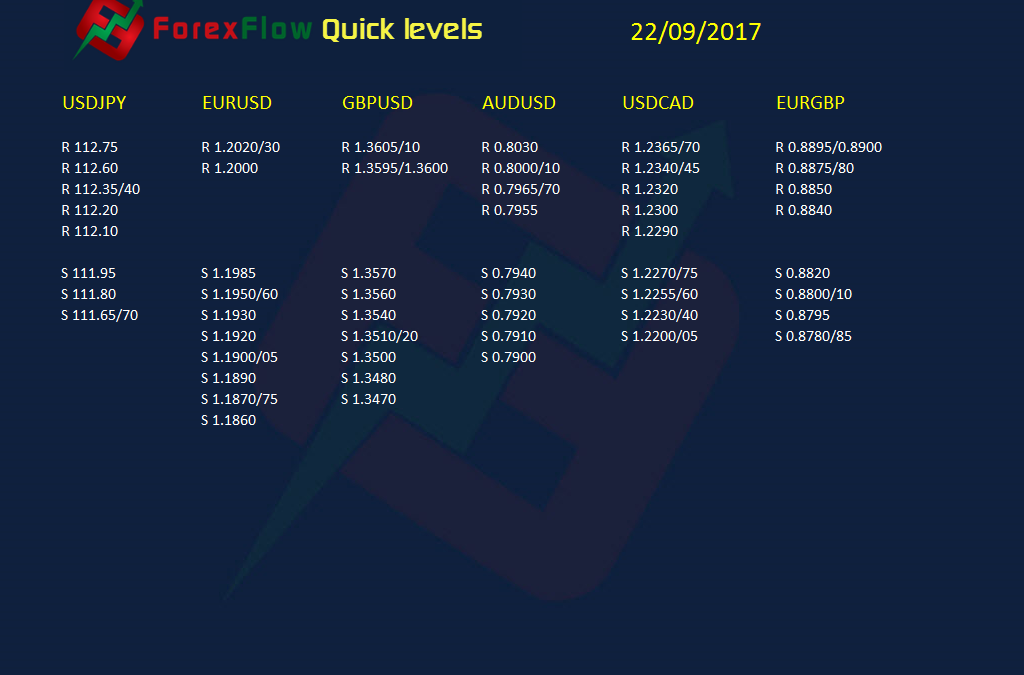
Here are some intraday levels to keep an eye on 22 September 2017
These are basically price action levels I see on the 15m chart. While things are fairly quiet, these are the levels that define the support and resistance. Obviously any big data points or comments will knock a lot of these out but it’s worth keeping the wider levels in mind for signs of those moves becoming stretched.
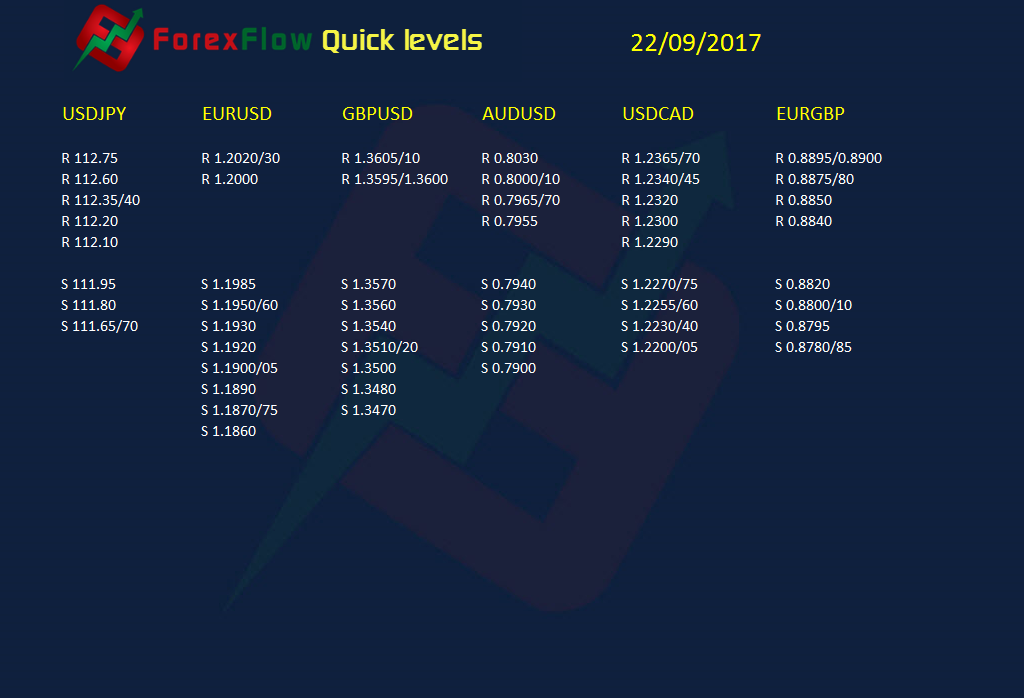
Quick levels 22 09 2017
Psychedelic chartist extraordinaire. Have your shades ready.
Philosophy: “Don’t be a Dick for a tick”
Read how Ryan got into trading here
Philosophy: “Don’t be a Dick for a tick”
Read how Ryan got into trading here
Latest posts by Ryan Littlestone (see all)
- The last NFP competition of 2022 - December 1, 2022
- Will this month’s US NFP be a horror show? - October 4, 2022
- US NFP competition – Do you think there’s going to be a turn in the US jobs market? - August 31, 2022