
A little later than usual but a more up to date look at the levels developing in today’s price action
These are levels I watch for each and every day on my 15m charts. For moves like today, it not only helps show where the support and resistance is intraday, but how it develops during such moves like this. Take GBPUSD as an example, the break of 1.3400 quickly truned to resistance. Then the support built underneath against the low and all it took was a trigger from the good CBI report to kick it back through 1.3400. Of course, you can say I’ve written that with hindsight but if you watched the PA, you could see that picture unfolding live. EURUSD ius at a similar point at 1.1760. Will there be a kicker for that?
Anyway, here’s how the picture looks now.
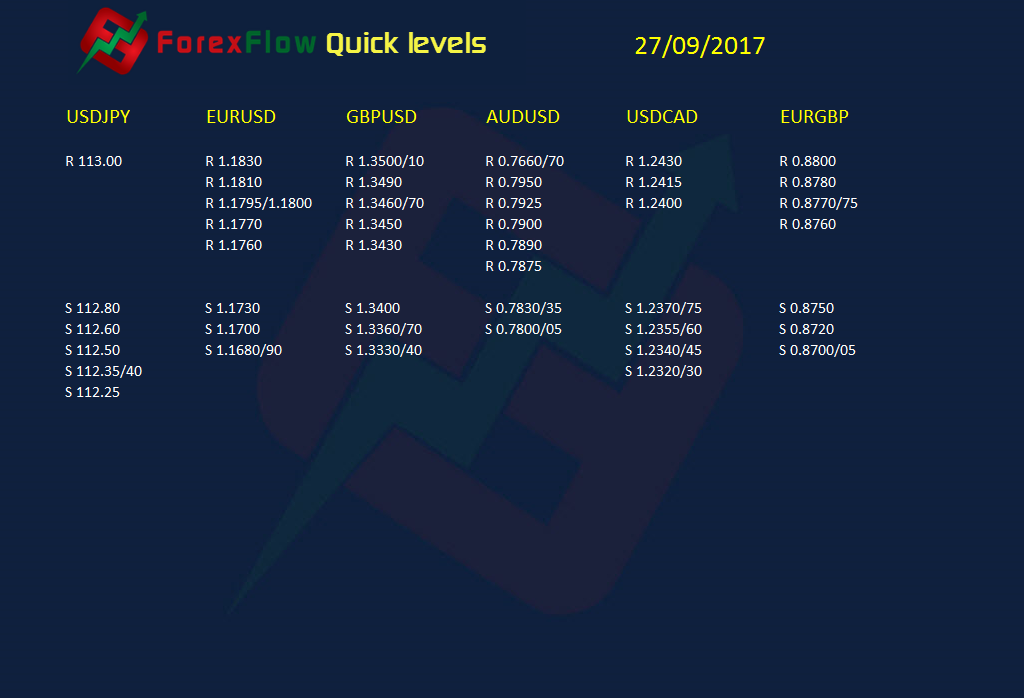
ForexFlow quick levels 27 09 2017
Psychedelic chartist extraordinaire. Have your shades ready.
Philosophy: “Don’t be a Dick for a tick”
Read how Ryan got into trading here
Philosophy: “Don’t be a Dick for a tick”
Read how Ryan got into trading here
Latest posts by Ryan Littlestone (see all)
- The last NFP competition of 2022 - December 1, 2022
- Will this month’s US NFP be a horror show? - October 4, 2022
- US NFP competition – Do you think there’s going to be a turn in the US jobs market? - August 31, 2022