
We’ve got a big line in the sand coming up for EURUSD
For shorts that piled in on the drop from the 1.20’s, they’re facing a final technical boundary. The 61.8 fib of the Sep drop is at 1.1887.
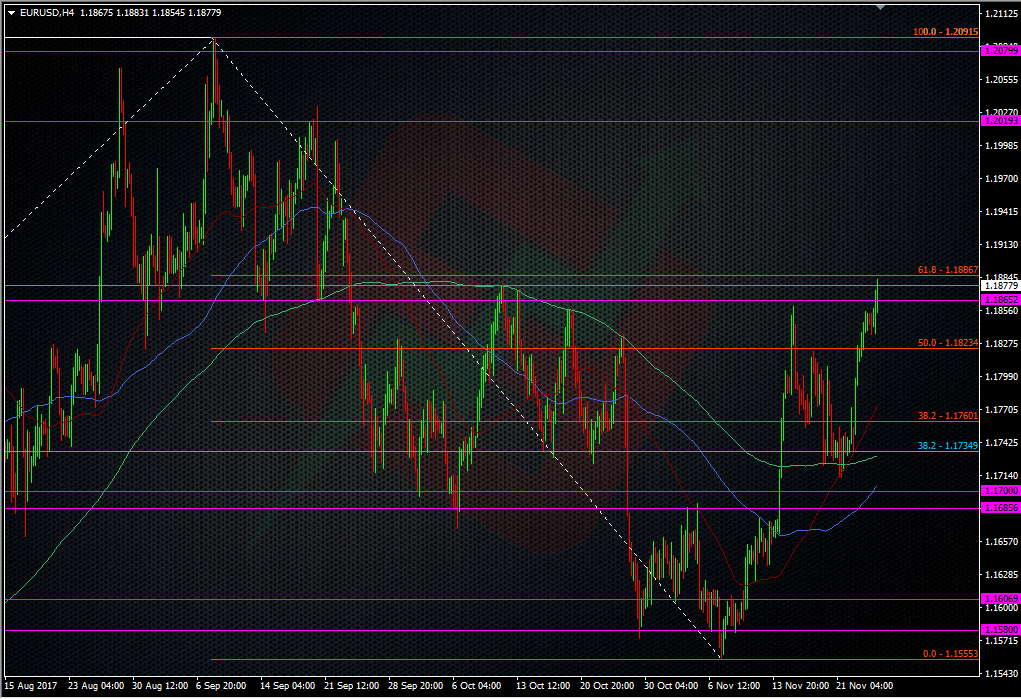
EURUSD H4 chart
There’s going to be natural big figure resistance here too but it’s the technical picture we’re interested in here. Over 1.1900 we have the 55 MMA at 1.1924, and that area has seen S&R action previously. Above that, the technical picture is pretty sparse until around 1.1980/85, though I’ll be watching for a speedhump around 1.1940/50. I’m still maintaining my EURUSD long position, which is close to its anniversary. My last trade was to take a tiny bit more off when it broke through 1.16 back in Oct.
If it can manage it, a close above 1.19 today would be a very bullish signal but simply maintaining the bid today will be positive in itself. The big support is sitting at 1.1850/55, and 1.1835 is after that. With nothing of real note on the calendar, we’re open to offers for inspiration.
Philosophy: “Don’t be a Dick for a tick”
Read how Ryan got into trading here
- The last NFP competition of 2022 - December 1, 2022
- Will this month’s US NFP be a horror show? - October 4, 2022
- US NFP competition – Do you think there’s going to be a turn in the US jobs market? - August 31, 2022