
The US dollar is starting the New Year the same way as it finished the old one
USDJPY continues to fall out of favour as we hit the first main trading day of the New Year. Here are some key levels to look at.
Support
- 200 & 55 WMA’s 112.33/28
- Early & Mid-Dec lows around 112.00, 100 DMA 111.95, prior support at 111.90
- 111.65/75 former S&R, 111.62 200 DMA
Resistance
- 112.50 is our old S&R level and there looks to have been some stops through it. Look for this to become resistance.
- 112.70/80, 113.00/20 is next resistance
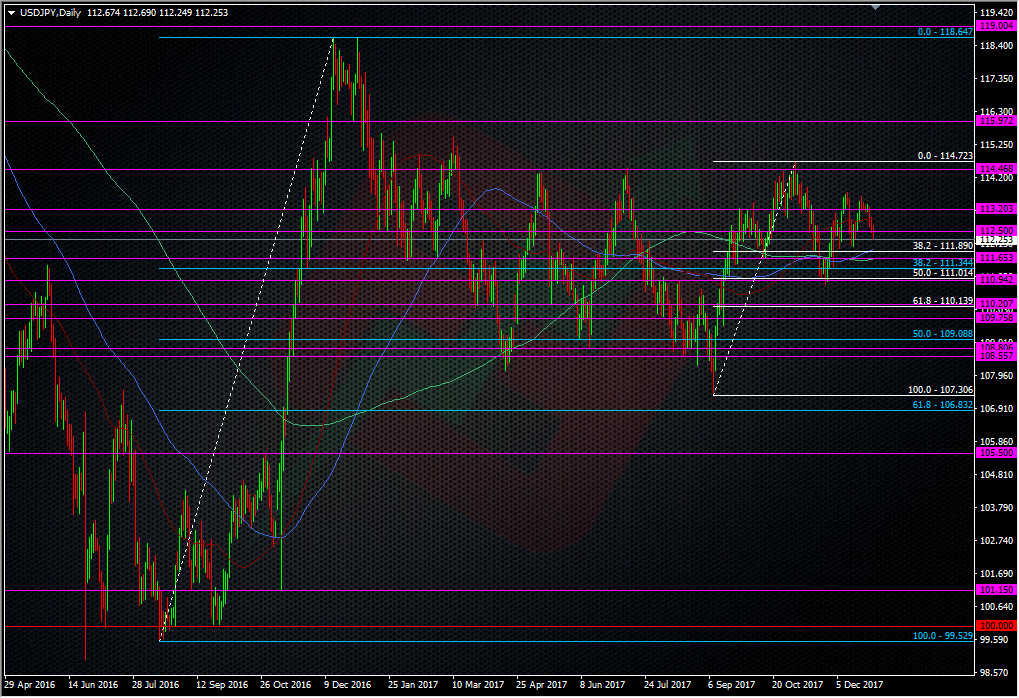
USDJPY daily chart
The downside is where all the action may be if we duck under 112.00. There’s a lot of traffic down to 111.65 so really that’s the big line to watch. A break there could mean a quick trip down to the low 111’s and the late Nov lows.
EURUSD is up testing the Sep highs and this will be a good test of this USD weakness. We have a very big level should we break 1.21 as the 50.0 fib of the 2014 Drgahi drop sits around 1.2166.

EURUSD weekly chart
1.21 could be a big level on its own, given how strongly it was defended last year. We could well see an explosive break should it go.
We’ll have to see how support builds within 1.20. At the moment it looks like 1.2040/45 it the main contender with 1.2020/30 a bit strong under that.
I’m always sceptical of moves over this holiday period but the one thing that stands out is that we’re continuing the moves seen before and during the holiday. That suggests that the moves are real and not just the result of year-end squaring and re-positioning. I’d still like to watch a few days trading before really accepting what the prices are doing though. In this environment it’s wise not to overcommit to trades and er on the side of caution.
Philosophy: “Don’t be a Dick for a tick”
Read how Ryan got into trading here
- The last NFP competition of 2022 - December 1, 2022
- Will this month’s US NFP be a horror show? - October 4, 2022
- US NFP competition – Do you think there’s going to be a turn in the US jobs market? - August 31, 2022