
Have the trading tables turned in the battle between the fundamentals and the BOC?
USDCAD made an important break below the 1.2660/70 level that had acted as resistance and support through the latter part of 2017. First and foremost, that could well be an important level should we go back to test it, and it could well be a trend changer. Meanwhile, to the downside, we still have a lot of work to do if we are to see the Sep rally unwind fully.
The 1.2500 level is next in line, and as reported on the options board, contains a barrier. With natural big figure bids likely to be sitting there, it could well put up stiff support. We’ve also got the large expiry today which is keeping the price in check. What happens after expiry could be defining. Under 1.2500 we have the 50.0 fib of the Sep move at 1.2488 and further support from the late Sep break through 1.2450.
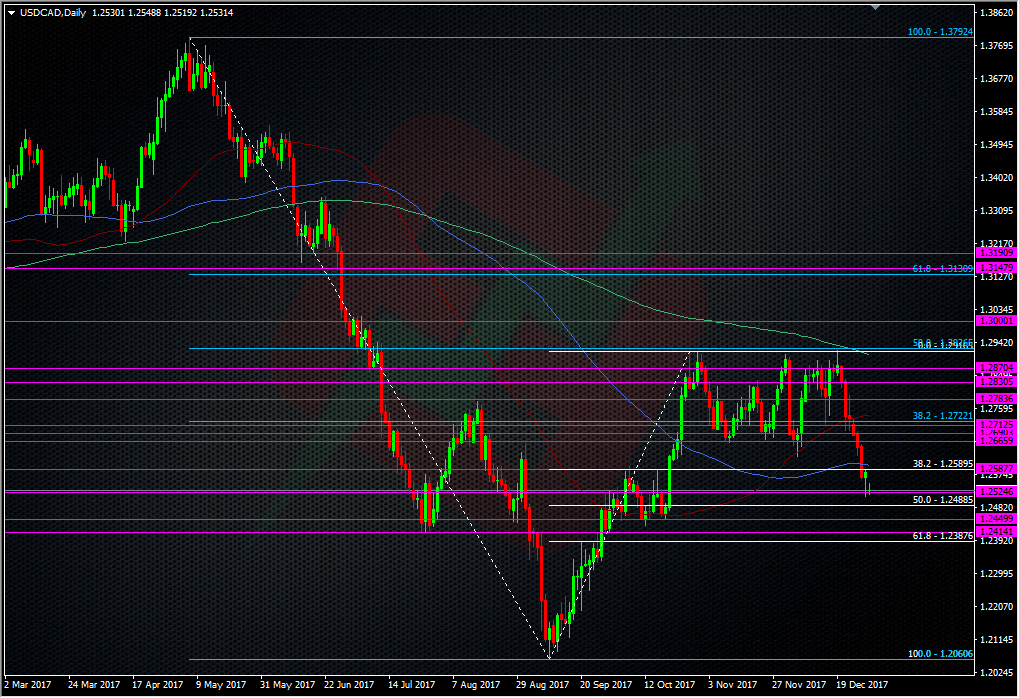
USDCAD Daily chart
1.2450 looks to be a similar sort of level to 1.2660/70 and there’s even the possibility of an extension down to 1.2415, which is another S&R level. It would take a break there and at 1.2400 to have us thinking about a move down to the 1.20 area again.
Most of this move looks to be mainly driven by general USD weakness, and CAD strength from the jump in oil, so there’s none of the main economic fundamentals behind the move. That leaves us open to see more volatility when we get to trade the data vs BOC expectations. The next BOC meeting is 17th Jan. The latest inflation data from Canada was very strong just before Christmas, as was retail sales, and that’s what helped send the pair lower in the first instance. That’s potentially given the BOC some better ammo to think about hiking again, and it’s certainly better data than I would trade against like I did last year. I made some good pips buying dips in USDCAD on good data and then taking profit into unchanged BOC meetings. However, given the recent data, I believe that the trade has changed and that shorting a USDCAD pop on an unchanged/neutral sounding BOC, to then TP into further good data, might be the way forward. That said, I do believe the technical picture highlighted above looks worthy of longs for a tight 1.2500 barrier scalp, or a slightly bigger and longer duration trade from the 1.2450 area.
Lots to consider and I’m sure this pair is again going to provide a lot of opportunities over the days and weeks ahead.
Philosophy: “Don’t be a Dick for a tick”
Read how Ryan got into trading here
- The last NFP competition of 2022 - December 1, 2022
- Will this month’s US NFP be a horror show? - October 4, 2022
- US NFP competition – Do you think there’s going to be a turn in the US jobs market? - August 31, 2022