
We’re at a potentially big level in USDJPY
We’ve been talking a lot about the 108 area in USDJPY and we’re knocking on a big level at 108.50.
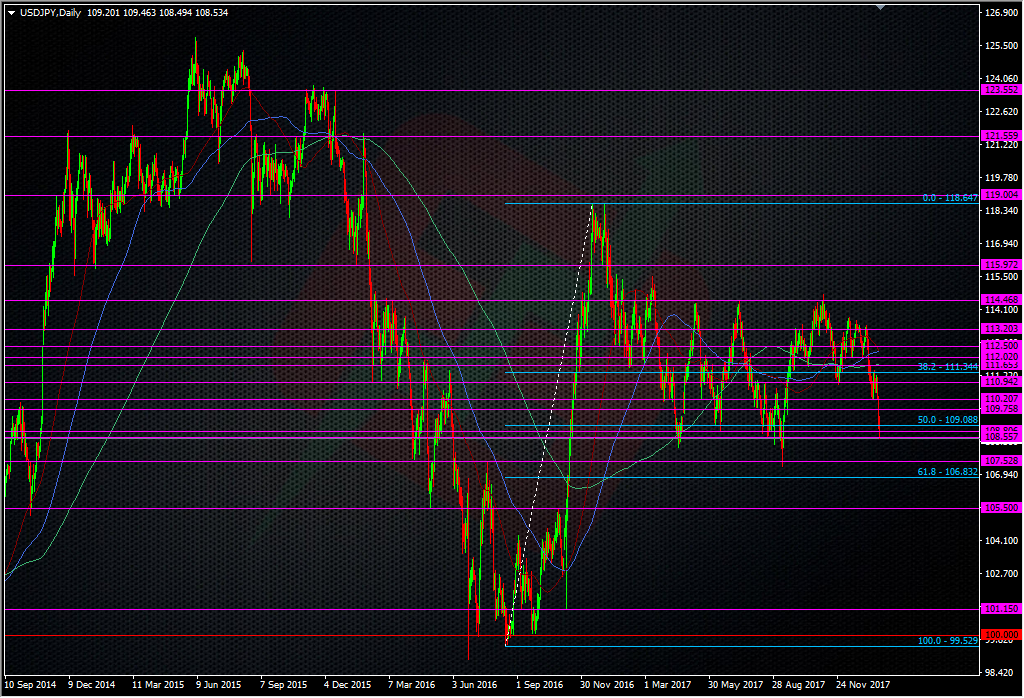
USDJPY daily chart
This is the low end of the 2017 range and it could define whether this dollar weakness is really going to pick up or whether this is just some short-term noise. Levels like this can make or break trends.
I’m watching this level (and down to 108) as a signal for a steeper drop but the caveat is that we have had breaks under here before. I would prefer to see the support points down here showing as clearly and concisely as the top of the range around the 114-115 area, so there’s still some caution needed before calling any break real. There’s not a lot we can do about that so it will be what it will be. To trade it, we’ve got one level here and the price will either hold it or it won’t. Take your pick, choose your poison, keep it tight.
Now that I’ve built this level up into something big, watch the price flim flam about now 😉
Japanese CPI data is the hot data ticket in Aisia, so be aware of that if you want to trade this level.
I’m still short EURJPY from earlier at 136.12 and I took half off at 136.00 when it was looking bid but I’m running the rest. My stop is down to 135.85 but I’m going to move it down further now we’ve had this tip to 135.45.
Philosophy: “Don’t be a Dick for a tick”
Read how Ryan got into trading here
- The last NFP competition of 2022 - December 1, 2022
- Will this month’s US NFP be a horror show? - October 4, 2022
- US NFP competition – Do you think there’s going to be a turn in the US jobs market? - August 31, 2022