
USDCAD could be at a make or break point soon
USDCAD is on the slide again as the winds puff the CAD’s sails. Oil rallying and NAFTA hopes are but two of those winds and we’re just testing the 200 DMA at 1.2635, with a low so far of 1.2636.
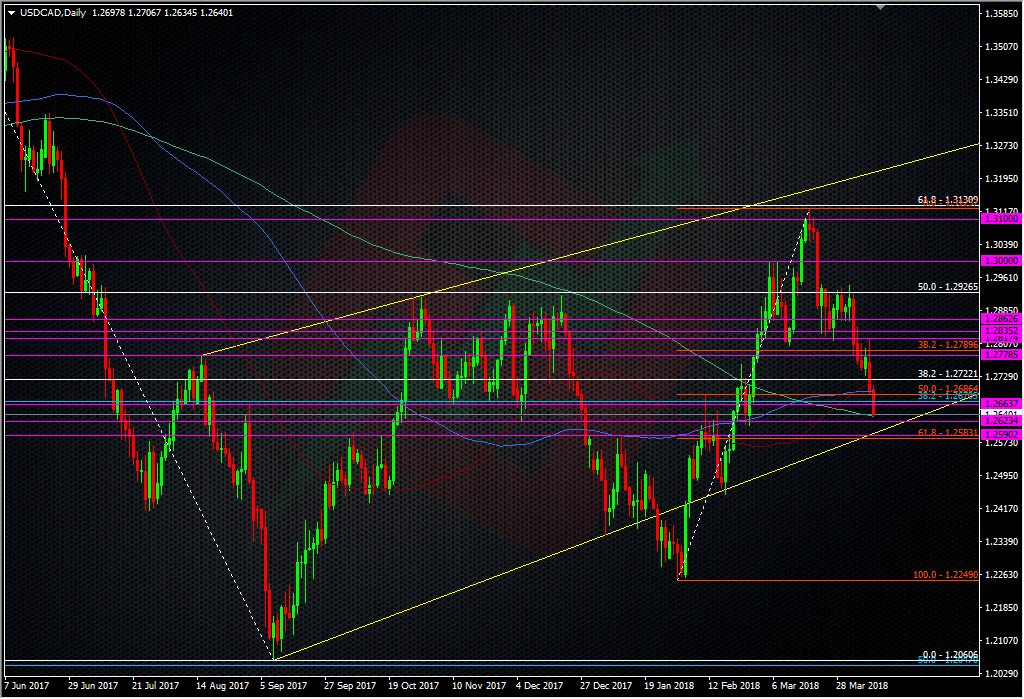
USDCAD daily chart
Under there we have an old S&R level around 1.2620 but the stronger level is down at 1.2600-1.2590, another S&R level, and a rising trendline. The 61.8 fib of the 2018 swing up sits just under there at 1.2583.
The ForexFlow squad have been all over this move south but shorts need to be wary if the 1.2600 level holds. For me, there looks to be a good low risk technical trade for a long from maybe 1.2605/10 with a stop just under the fib, though if 1.2590 breaks, the damage may already be done. This pair is still a volatile bugger so it’s not one I’m prepared to give a big leash too. Trade tight off the levels and see what happens.
Philosophy: “Don’t be a Dick for a tick”
Read how Ryan got into trading here
- The last NFP competition of 2022 - December 1, 2022
- Will this month’s US NFP be a horror show? - October 4, 2022
- US NFP competition – Do you think there’s going to be a turn in the US jobs market? - August 31, 2022