A very strong historical support and resistance point is back in focus
NZDUSD has a key level just above the current price and I only need to let the chart do the talking.
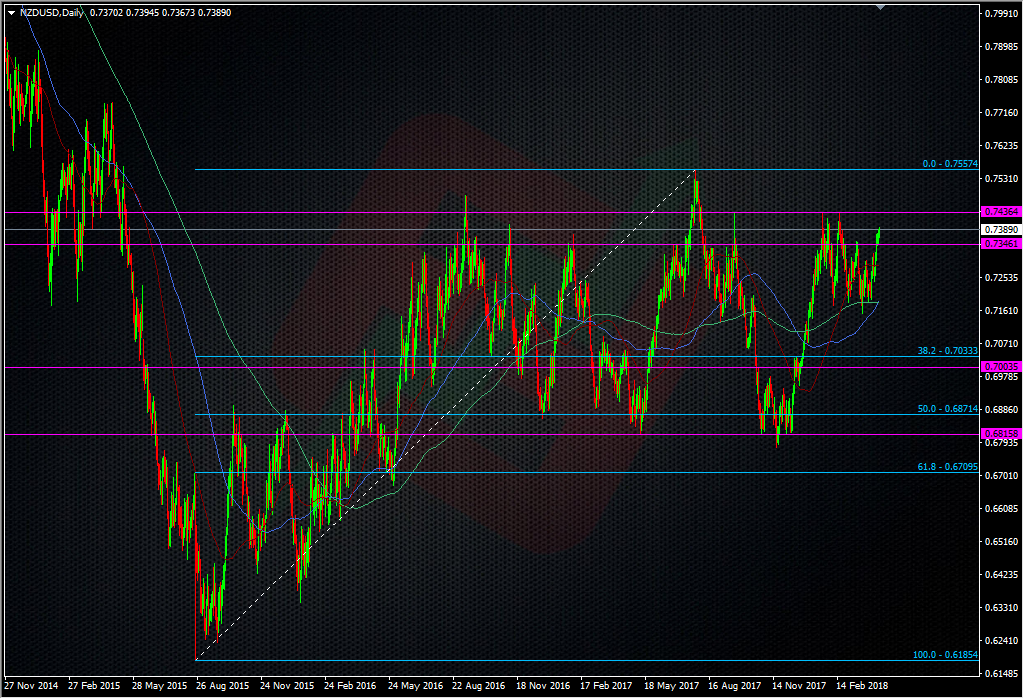
NZDUSD Daily chart
The 0.7430/40 area is the level I’m talking about and if you stick a line in there and hop into a weekly chart, you’ll see the area has been a player all the way back to 2007.
As we often read in financial disclaimers though, past performance is not an indicator for future performance (or some bleeding obvious statement like that), so we treat the level for what it is. It does look strong, and certainly was the last few times we were up here. These are the sorts of levels we wait for but we have to judge the moves at the time.
I’m interetsed in a technical short into that level but I’m fully aware of the underlying sentiment right now, and that’s short-term bullish. The mark of a currency move is judged against levels like this. If we hold, then the 0.7200/0.7400 range stays in play. Break above and we might be looking at a range break. Whatever your thoughts are, this is one line on the chart that the price will either go above, or it won’t. That’s all trading technical trading is, ‘will it, won’t it?’. With that in mind, I like the look of a short to test the level but I won’t need to give it a lot of room if it breaks. Maybe just above 0.7450 or 60 will be where I look to put a stop. I’ll repeat though, just like the USDJPY short I was looking at around here at 107.50/60 (which I’m holding back from), I’ll judge any move to 0.7430/40 as it happens to see what the price action tells me.

Philosophy: “Don’t be a Dick for a tick”
Read how Ryan got into trading here
- The last NFP competition of 2022 - December 1, 2022
- Will this month’s US NFP be a horror show? - October 4, 2022
- US NFP competition – Do you think there’s going to be a turn in the US jobs market? - August 31, 2022