
The 1.2900/30 area keeps getting tested
This 1.2900/30 area in USDCAD has been a very sticky point for quite some time. Moves above are often fleeting and limited to topside big figures. It’s a strange area with no real rhyme or reason behind it.
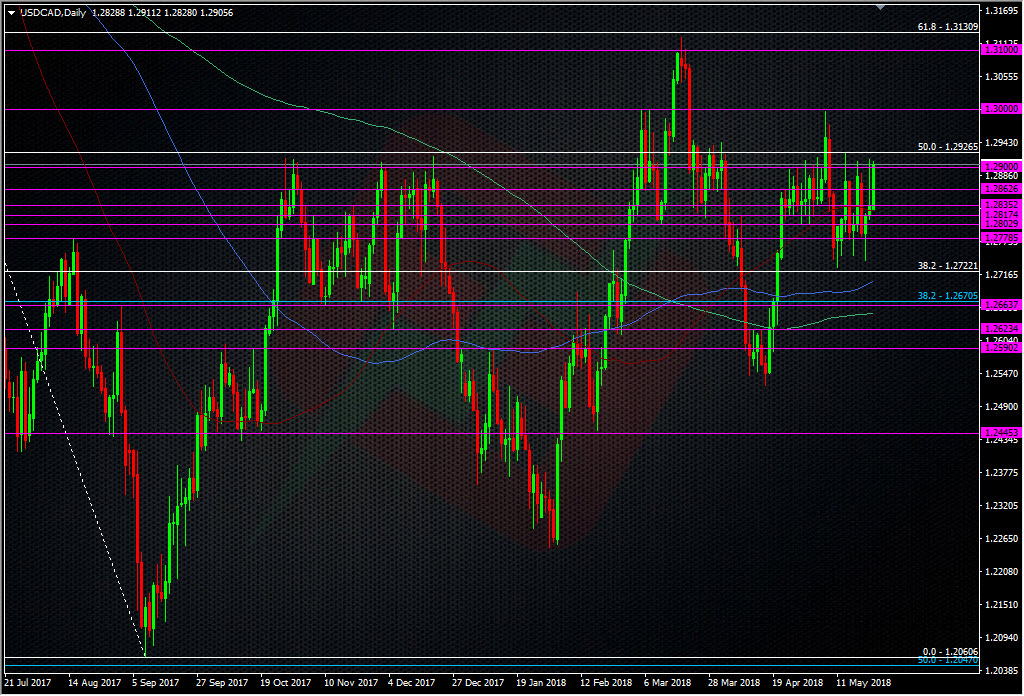
USDCAD daily chart
We do have one ongoing reason, and that’s the DNT in play 1.2625 to 1.2925, and the topside has been defended well recently. That’s only a short-term play so could well expire just after the BOC. We keep coming back though and that’s always a bad sign for a level.
While the resistance holds, shorts can be happy with a tight trade into 1.2910/20 with a stop just above 30 but again, watch these multiple re-tests carefully. A wise play would be to reduce trade sizes each time, just in case it does break. Should it break then leaning on 1.30 is the next place to look.
For longs, if buyers can have a little patience and wait for the mid-low 1.27’s, they’ve been rewarded regularly this month.
The drivers at the moment remain oil anf NAFTA so go with the flow of those too.
With the BOC next week we could be in for some fun and games.
As I type, we’ve just hit 1.2920 and I’ve gone small short at 1.2915, stop at 30.
Philosophy: “Don’t be a Dick for a tick”
Read how Ryan got into trading here
- The last NFP competition of 2022 - December 1, 2022
- Will this month’s US NFP be a horror show? - October 4, 2022
- US NFP competition – Do you think there’s going to be a turn in the US jobs market? - August 31, 2022