We’ve a break of the USDJPY range so where do we go next?
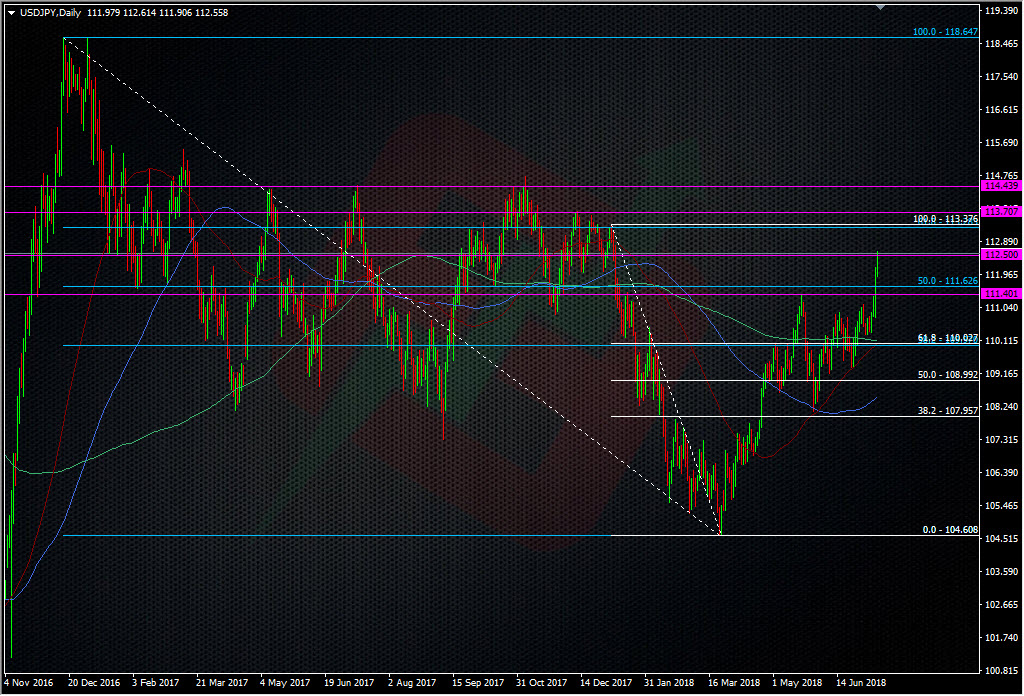
USDJPY has decided to go for a wander and we’ve broken the recent range top around 111.40, and moved all the way through to 112.63. As I’ve been mentioning, it’s been one of those ‘take no prisoners’ moves where the price crawls up with a strong bid behind it and gives very little in terms of retraces. When it moves like this it’s hard to trade because we’ve been used to trading within the range and now it’s not. We don’t want to chase the move but it’s not giving us a good dip to get on the train.
What do we do then?
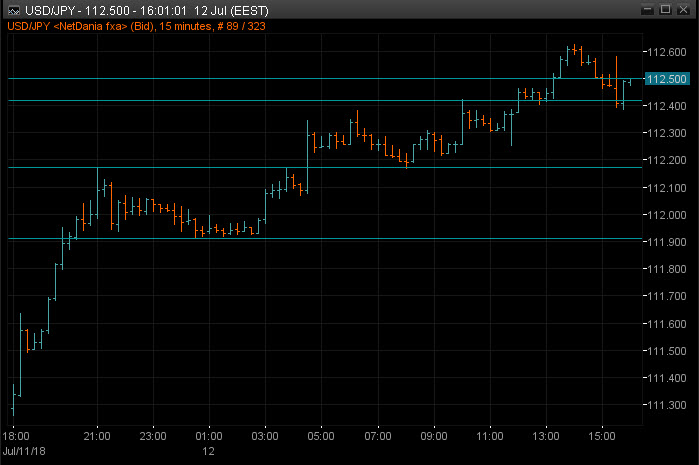
Let’s look at the 15m chart.
We can clearly see that dips have been very shallow so if we want to trade them, we have to keep it tight and not go overboard with our trade size. I’ve done just that in playing the 112.50 level I’ve had a thing for for a while. I’m long at 51 with a stop under 40. If that breaks, the next level is down at 112.20, or at 112.00 with a stop under the support at 111.90.
We have levels where we can try and get on the train but if the train derails, we don’t want to be holding a big bag of poo, so we keep trades tight and we don’t go large. If we want to try and pick the tops then we do the reverse. We can go against the 112.60 level or trade a hold under 112.50, or go with a break of 111.90 or a confirmation of a 112.00 break. All in the space of 60/70 pips we can find levels trade without overdoing our risk.
To the bigger question, where does it go next?
This break has the potential to push on to test the big 114 area and the series of strong tops going back to last year. Before that we have the confluence of fibs and prior resistance around 113.30/40. We also have the 200 WMA at 113.18. The 114 area is the big one and that where we could see real fireworks.
For now, we need to see if this move is something real or if it’s just this pair letting off some steam after being asleep for the past few weeks.
What I do like the look of right now is the confluence of MA’s down around the low 110.00’s. We have the 200 H4MA at 110.14, 55 & 200 DMA’s 110.02/10 and the 55 & 100 WMA’s at 110.33 & 110.12. That’s a juicy batch of tech in a pretty tight area. It’s also the scene of some old fib levels and although I don’t usually look at broken fibs, in this case, it may also add to the tech picture already there.
Fundamentally, I don’t see any reasons for this pair to move massively any which way. I see 120 being as fanciful as 100 right now. Unless we break the high 114’s or 108’s, we’re still in the bigger range so those two edges will be my guide. At worst this is just a short-term move, at most it’s just another move to a new range within a range.
We have the short-term intraday picture to watch, and the wider picture to gaze at too. Something for everyone I hope.
- The last NFP competition of 2022 - December 1, 2022
- Will this month’s US NFP be a horror show? - October 4, 2022
- US NFP competition – Do you think there’s going to be a turn in the US jobs market? - August 31, 2022


