Don’t get lulled into a false sense of security when daily trends find support
Here’s something I just wanted to point out using the GBPUSD 15m chart.
It’s a mix of the blatantly obvious but also an important lesson.
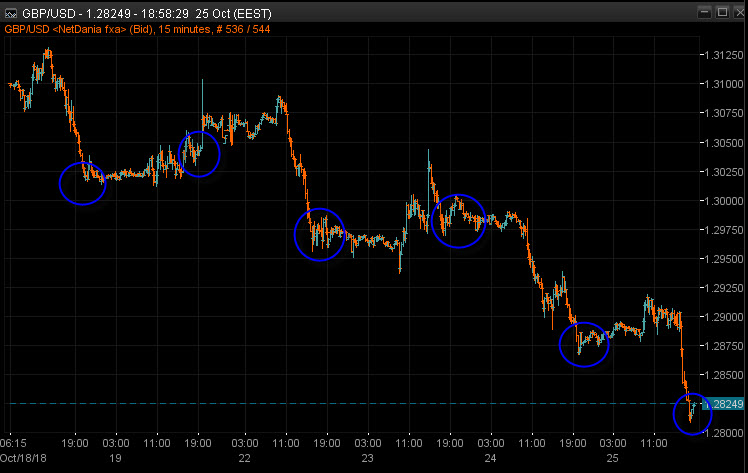
GBPUSD 15m chart
The circles are drawn at pretty much the same time of day, which is right now (the chart is on GMT+2 for some reason). It shows the pattern of fx markets dying down as UK and European traders finish up. That’s not new news, it happens often. But, what it also shows is that the trends are showing some very clear dead cat bounces. The reason I’m highlighting this is that these support points can lure people into a false sense of security because they’re built on much lower liquidity rather than a fully liquid mood of buying (in the case of cable. So, when the next day arrives trader might think these support levels are stronger than they actually are. As we can see, that’s not the case because they’ve all pretty much busted without a second thought.
Why is that important for our trading?
A couple of reasons.
- The knife catchers among us keep losing fingers. Yes, there’s scalping opportunities but looking outside of that hasn’t been productive for buyers. There are no signs of a real bottom coming in, and there won’t be until one of these former overnight support breaks are retaken and are confirmed further by support building there
- Support needs to be defined at a more liquid time of the day
At some point markets reverse or retrace, that’s the natural order of things but it’s only through seeing and learning from the price action do we stand a chance of catching that move. That’s not just for longs trying to catch a reverse, it’s important for shorts to see when their train ride might be at an end. Combine that with the normal exercise of defining the nearest levels on your chart and that potentially puts you in a good position.
Right now, cable is in one of those places where we’ve had days of moves south without much reply, so we think we might be too late to join the selling now but have no confidence in buying. All we can do is look at the levels (I see the nearest support at 1.2800-1.2785, and resistance at 1.2920) while keeping in mind how the price action has been behaving. All that together allows us to base our risk on any trades appropriately. In the case of cable, I’d play longs with very tight stops, and allow shorts a bit more room. That would be until I saw firmer support developing. Only if I then saw the price stepping up support, and more of the old resistance levels breaking, would I consider switching the other way and tightening stops on shorts and giving more room to longs.
It’s not for us to stick a wet finger in the wind to guess find next direction. Only through reading the price action can we gain greater certainty of which way a price goes next.
Philosophy: “Don’t be a Dick for a tick”
Read how Ryan got into trading here
- The last NFP competition of 2022 - December 1, 2022
- Will this month’s US NFP be a horror show? - October 4, 2022
- US NFP competition – Do you think there’s going to be a turn in the US jobs market? - August 31, 2022