
USDJPY pushes further from 108 as it looks to get back in its groove
Yesterday I discussed whether USDJPY would get back into the long-term range or find a new one below 108.00 after last week’s shenanigans . Today, it looks like we’re back in the 108-114 range, as support has continued to step up from the big fig to 108.50 and 108.75.
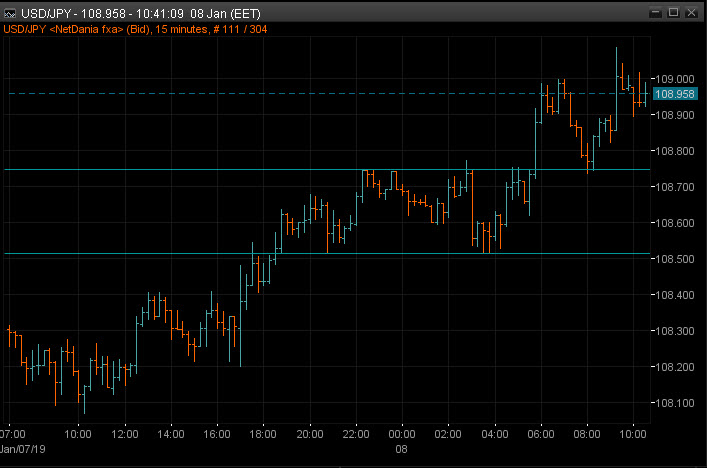
USDJPY 15m chart
109.00 broke fairly easily after a an initial test (which then confirmed the support at 75) but then went through by 9 pips. Since then, sellers have capped the level once again and so the battleground is now 108.75-109.00.
If we take 109.00, 109.35/40 is the next level to watch followed by 109.60/70, 110.00 & 110.20.
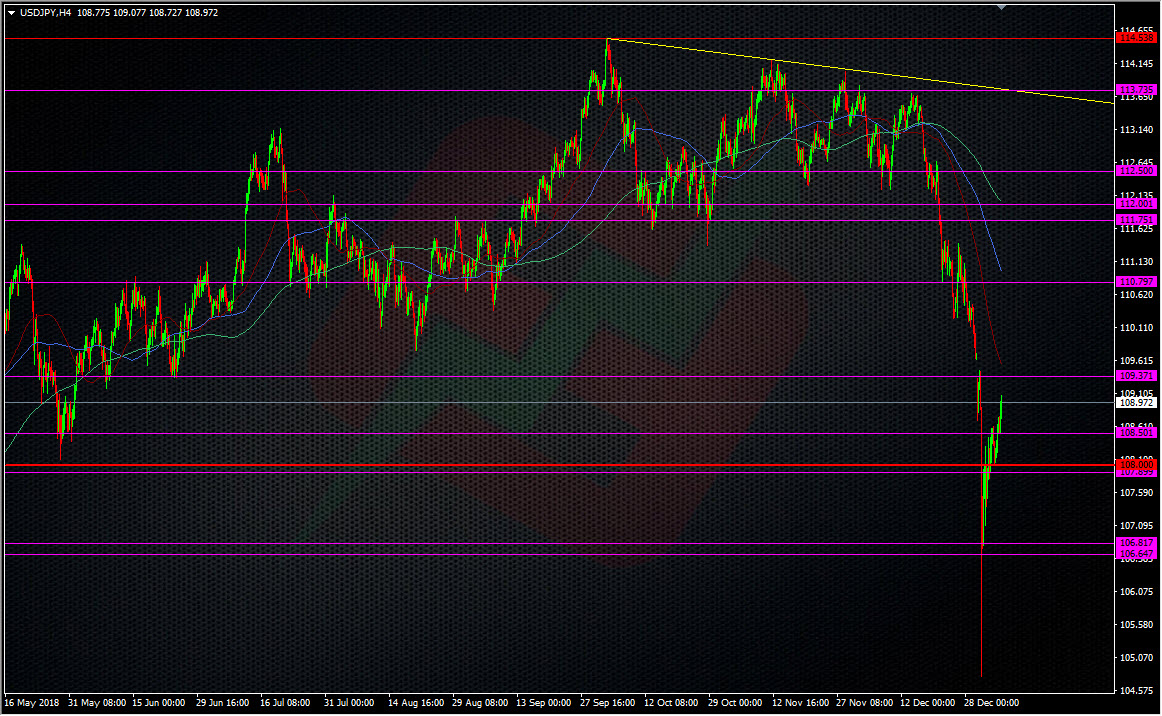
USDJPY H4 chart 08 01 2019
I still favour the long side for the moment as the wash out increasingly looks like a one-off. Getting in has been the difficult part. I might have a nibble at 108.75 but would be more inclined at 108.50.
Philosophy: “Don’t be a Dick for a tick”
Read how Ryan got into trading here
- The last NFP competition of 2022 - December 1, 2022
- Will this month’s US NFP be a horror show? - October 4, 2022
- US NFP competition – Do you think there’s going to be a turn in the US jobs market? - August 31, 2022