
This post explains some tried and tested methods for trading breaks
Watching the price action is very important because it helps us understand what the market is doing. Here’s two methods for watching, identifying and trading around a possible break.
Method 1 – Trading a break of a big level
I’m going to use EURUSD at 1.1500 for this first example. What we had here was a very strong resistance level that had been in place for several months. We also had a fresh barrier in play that came into place after the October break lower and run to 1.12.
This marked the top of the 1.12-1.15 range and was a great place to short. However, there was an underlying trend developing where the lows were getting higher and we then saw that trend accelerating into the new year. We can see that clearly on the chart below.
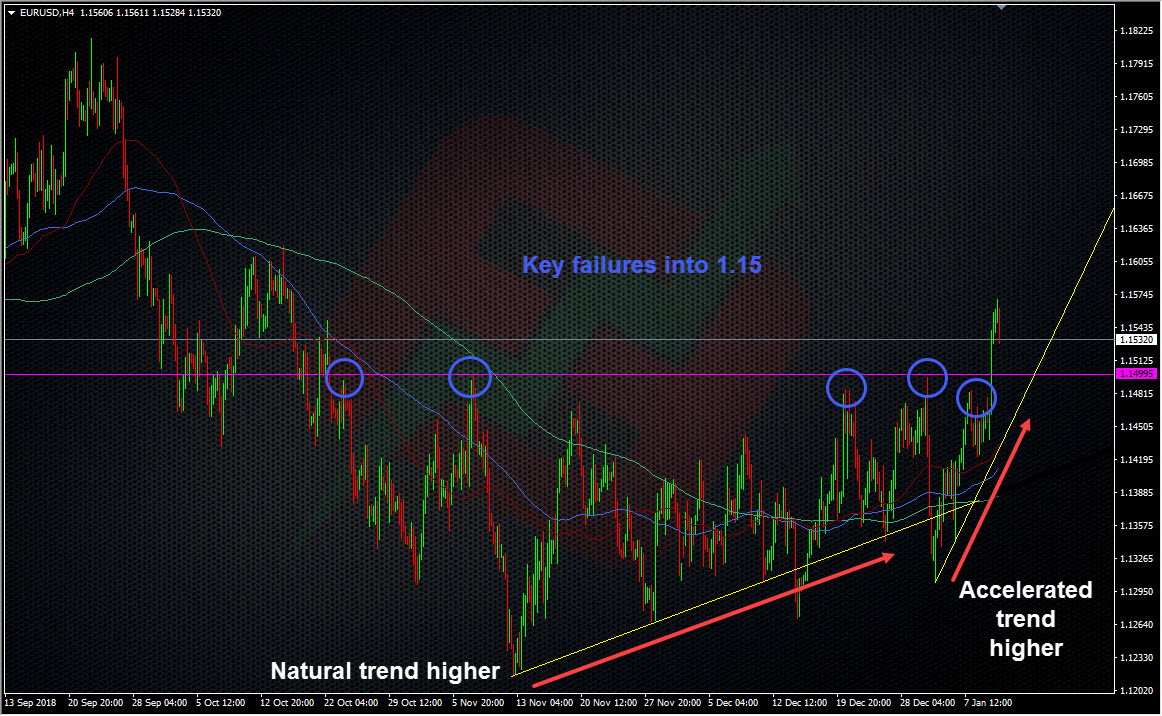
EURUSD H4 chart
Here we can see the way we had several strong rejections from 1.15 over a good period of time, and therein lies lesson 1. Levels can be trusted on a test if it hasn’t traded for a while. What I don’t like is multiple tests in quick succession (more on that in a moment).
So, we had a strong top in from October with a slow and steady natural trend higher from the lows but the key move was into the new year and the accelerated trend higher. That acceleration came from around 1.13 after another fail at 1.15 Jan 2nd. This is when the price action changed. EURSD looked increasingly supported and it forced those protecting 1.15 to step down to around 1.1480, hence why the main break happened through there instead of at 1.1500.
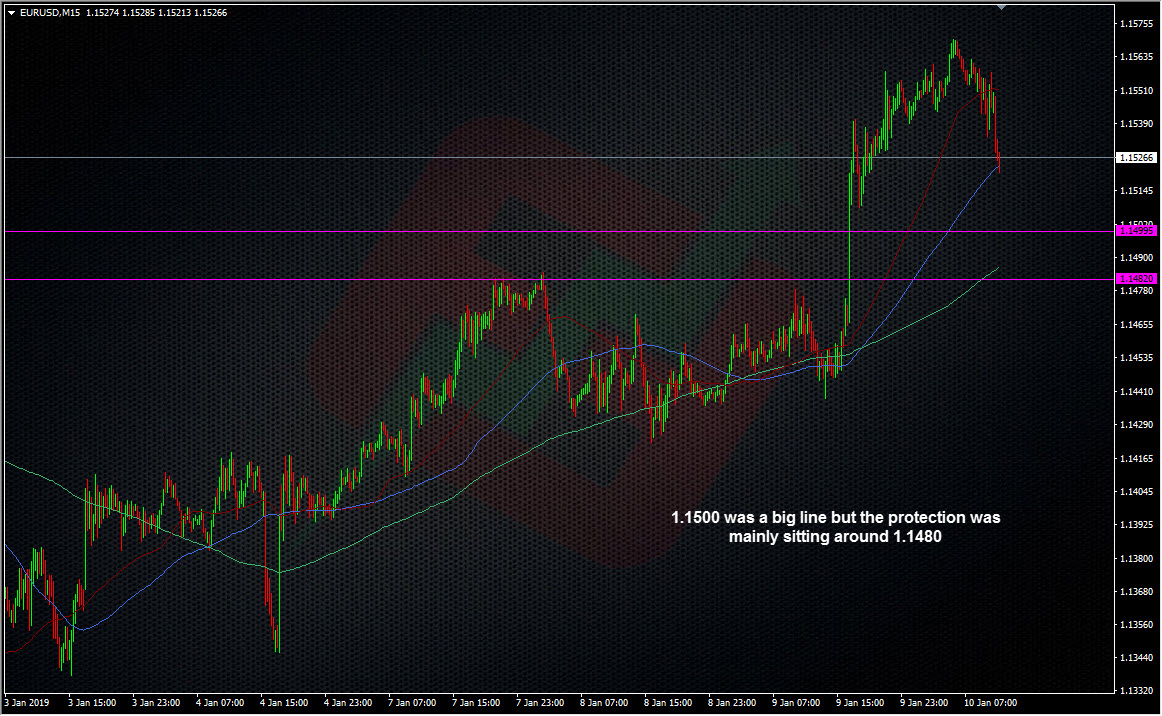
EURUSD 15m chart
What we saw was an increasing bid sucking up the dips and that highlights lesson 2, not liking a price coming back to a big level for multiple tests in quick succession. This price action is a first indicator that something had changed.
Now that we see a price building support and constatly pushing a resistance level we can start to think about changing our strategy. We can still trade the short into 1.15 but we need to factor in the price action which shows that buyers are looking stronger than they were. In this instance it’s purely price action and experience that told me (and others in the trading room) that the chances of a break were increasing rapidly. The lesson of quick multiple tests was a signal to think about a break.
The strategy here was to then plan for a break and there are two ways to do that.
- You buy on the dips looking for the break
- You enter buy stop just above to catch a break
The problem with strategy 1 is that you are relying on abreak happening and in this case, a break of a significant level. Nothing is ever guaranteed in trading so if the break fails, you’ve got to know when to get out.
Strategy 2 only happens if the level breaks so there’s no risk if it doesn’t. However, the risk is that we see quick flush and reverse but that wasn’t the expected outcome for this level because it had been a long-term resistance level and the longer it resists, the bigger the break is likely to be when it happens. It’s all a matter of scale (and I’ll touch on that shortly too).
A third way to catch a break is to wait for a confirmation. That’s when price breaks, runs higher and then retests the broken level. If it holds, you’re good to go. If it doesn’t, you need to sit back and see what happens. With EURUSD and 1.15, we got a strong break and then we also got a confirmation hold around 1.1506/07. Textbook stuff.
For this trade I wanted to play it both ways, with a short into 1.15 and then a stop reverse into a long if it broke. As the price action developed I became less and less confident of a short so adjusted my risk to match that. I reduced the short trade size and increased the buy stop size. On both side my risk was very tightly contained to some 12 pips on the short and 17 on the long, so if the level had messed around and faked out, 29 pips was my risk if both trades failed. That’s fairly low risk for trading such a big level.
To summarise method 1.
- Judge a level in a time context. The longer it exists and holds, the greater the break will likely be
- Listen to what the price action is telling you. Level’s aren’t broken until they’re broken but the PA can tell you when it’s more likely to happen
- Adjust your strategy to match the price action
- Stick to your rules and discipline for trading big levels. Mine is, the more times it tests in shorter amounts of time, the more likely it’s going to break.
Method 2 – Trading a break of a weaker level
I’m going to use USDJPY at 108 as this subject matter. This is more about protecting yourself against a break and what to look for in the price action to do that.
In previous posts I mentioned that the 108 level was key and that it was a place I wanted to buy into. This had been a key long-term support level far bigger than 1.15 in EURUSD except it got blown up in the flash crash. That meant it had to redevlop itself in the days after, and it did just that. It became an important level again. Hold above, and the price goes up, hold below and it goes down. One line, clear direction. However, despite being a long-term level, we had to treat it as a short-term level, which meant using a matching strategy.
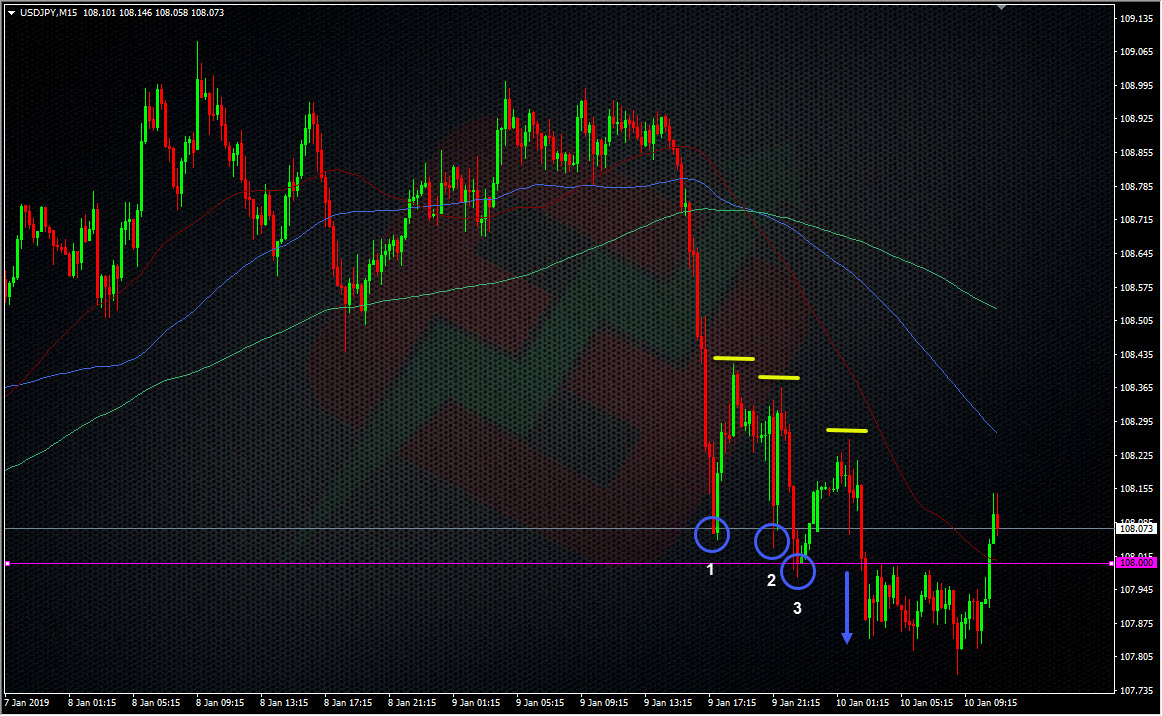
USDJPY 15m chart
What we had was a failure at 109 and USD weakness sending us down to test 108. I narrowly missed a bid at 05 on the first test that would have brought asome decent pips but while I’m watching the PA I’m also thinking about my rules, and particularly lesson 2 above on quik re-tests. What did the PA above tell us? The price was happy to bounce but it didn’t go that far and it came back to test 108 very quickly, within minutes in fact. That’s a big fat flashing warning sign. Each test went lower and each bounce was lower. Watching that move I immediately pulled my bid because I didn’t like that PA and that’s my rule and discipline. Yes, there was good pips available on the second and 3rd bounce but that doesn’t happen often in my experience. Usually we only see 10/15 pip bounces and then you’re trying to squeeze pips out of very tight price action. So, I left it alone and at the fourth attempt, it broke.
Being a shorter-term level I had no interest in going with a break on this one. That decision once again came down to the matter of scale. For EURUSD the bigger scale gave more potential room. For this move, we’re on a much smaller scale, so we see a much smalller break and tighter price action. The break can be traded, as the chart above shows but the strategy is just to scalp maybe 5/10/15 pips, keeping stops just as tight over 108.
The difference between trading a break here vs the EURUSD example is that with EURUSD, the trade is to catch the break, and here it’s to protect yourself from one.
The overall lesson to be learned
You’ve heard this one before, “Price action is king” and that’s really the big lesson here. The price action can tell you what the market is doing, and on occasion, it can give you a good indication of what it’s going to do. In the case of EURUSD, the PA was hugely compelling for a break so it gave us a chance to set our strategy to catch it if it happened. But, we have to take the context and scale of the levels in play into consideration to set those startegies and how to manage our risk when doing so. We have to follow our own rules in how we use the PA and our strategies and not let the FOMO or promise of profits overule our discipline.
The examples I’ve highlighted here are two extremes, long-term vs short-term and it’s up to us to scale our strategies to match those conditions. The bigger the level, the bigger the possible break, the smaller the level the smaller the possible break. Once you understand that you can manage your expectations and be more greedy on profiting from one (the big level), and more cautious on profiting from the other (the small level).
Philosophy: “Don’t be a Dick for a tick”
Read how Ryan got into trading here
- The last NFP competition of 2022 - December 1, 2022
- Will this month’s US NFP be a horror show? - October 4, 2022
- US NFP competition – Do you think there’s going to be a turn in the US jobs market? - August 31, 2022