
Do you often feel the need to fight big moves? This post should help you.
We had a discussion in our trading room about fighting trends yesterday, and whether people can resist the urge to “sell it because it’s gone up big and therefore must come down again”. It’s in a lot of traders nature to try and fight trend moves by trying to pick tops in rallies, and bottoms in sell offs. There’s often a mental block that a price is trending, and that more often than not, leads to traders losing money.
How can we avoid doing that?
As always, the price action matters. When prices go from ranging to trending the tech levels in the way can fall like dominos. That can make it tough for traders using them to lean on for entry trades. If you want to pick tops or bottoms in a trend, follow 3 simple clues (I’ll use a rally as an example).
- Wait for a top to appear that has a decent pull back.
- Watch for another move towards that top. If it breaks the high, the trend isn’t over. If it pulls up on or short of the high, that’s a sign of exhaustion.
- Watch for a double top, preferably with a good amount of time between the first high point.
Here’s two examples we looked at in the room yesterday, so before the latest moves happened.
In this first AUDUSD chart, we’d already had signs of a pause in the trend. We had a high (clue 1), and then the PA after came up short in various moves after. The first failure after the 80’s high is the important one (clue 2).
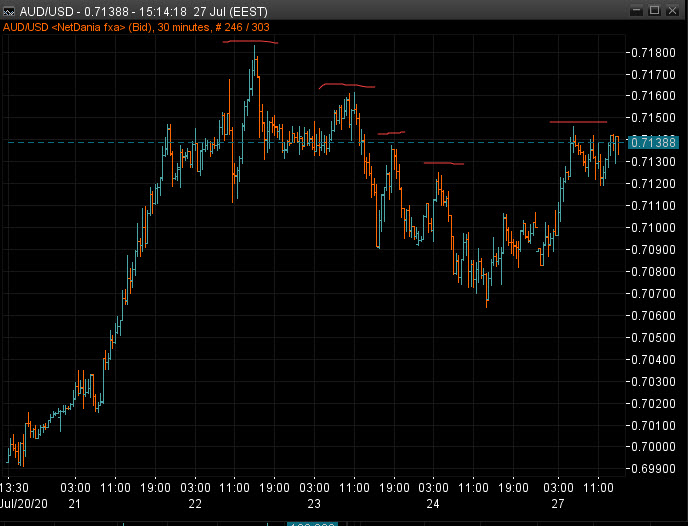
AUDUSD 30m chart 27 July 2020
And today, we got the proper high confirmation (clue 3).
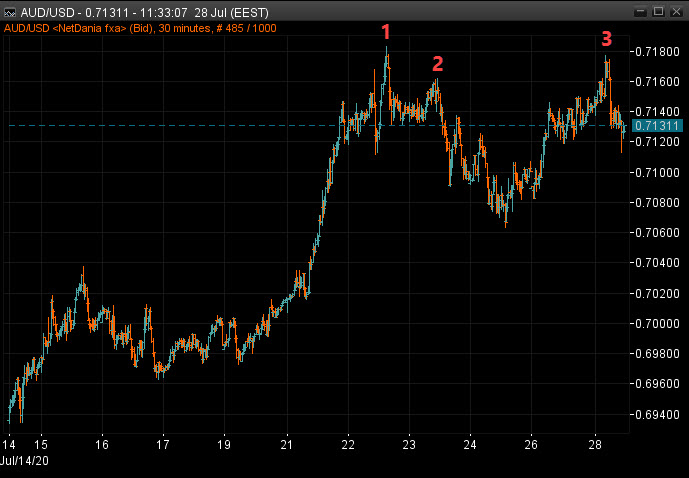
AUDUSD 30m chart 28 July 2020
Compare that to EURUSD. Yesterday, we were still trending, hence the s/t tops and continued breaks. This is not the right time to fight the trend.
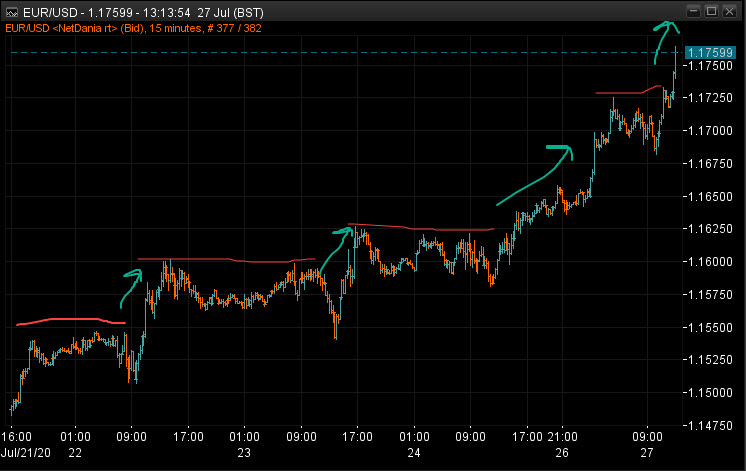
EURUSD 15m chart 27 July 2020
Then later in the day and overnight, we got the confirmations.
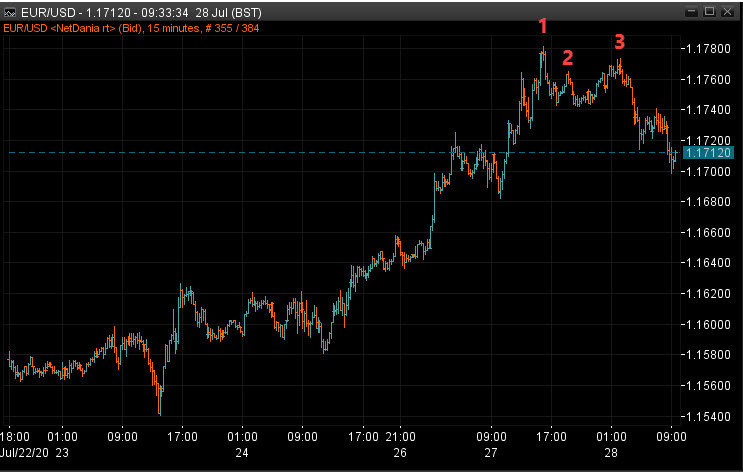
EURUSD 15m chart 28 July 2020
For those wanting to fight the move, after clue 1, shorts can be attempted into the prior high but need to be kept tight. If that works (clue 2), the same can be done on another retest, using the clue 2 high as a start point but again keeping it tight above the clue 1 high. If a high is confirmed again (clue 3), a deeper pullback is likely. If the clues don’t play out (the clue 1 high breaks), all bets are off as the trend is likely to continue. In that instance, it’s back to the drawing board and watching for a new clue 1.
The time difference is a key element for judging the strength of the pattern also. AUDUSD is stronger as it’s over a longer period than EURUSD, and so that strength or weakness needs to be risk managed accordingly, i.e more faith in shorting the AUDUSD highs than the EURUSD highs.
All the above confirms that a trend has at least paused and it’s the price action clues that tell us that. These clues are what traders should look for before attempting to fight the trend. It can mean the difference between being wrong often or being right more often. Once the pattern is confirmed, we can then move on to the next phase of planning future trades (more shorts or a break play), using the now defined levels.
This is but one type of price analysis we do each and every day in the ForexFlow platform. We’re always looking for the clues that lead us to the most safest and potentially profitable trades, be that trading tops, bottoms, breaks or failures. At every stage we plan, plan, plan and with experience you learn to define what strategy is needed in what situation, and then to tick the boxes towards a trade. If you’d like to learn how to do that, come and join us here.

Philosophy: “Don’t be a Dick for a tick”
Read how Ryan got into trading here
- The last NFP competition of 2022 - December 1, 2022
- Will this month’s US NFP be a horror show? - October 4, 2022
- US NFP competition – Do you think there’s going to be a turn in the US jobs market? - August 31, 2022