
USDCAD is playing between the lines
It wasn’t so long ago that I was looking to short into the top of the June down trend but I sat back to see what the CPI data might bring. The strong CPI read knocked that plan into the bin and helped send USDCAD on this slippery slope lower.
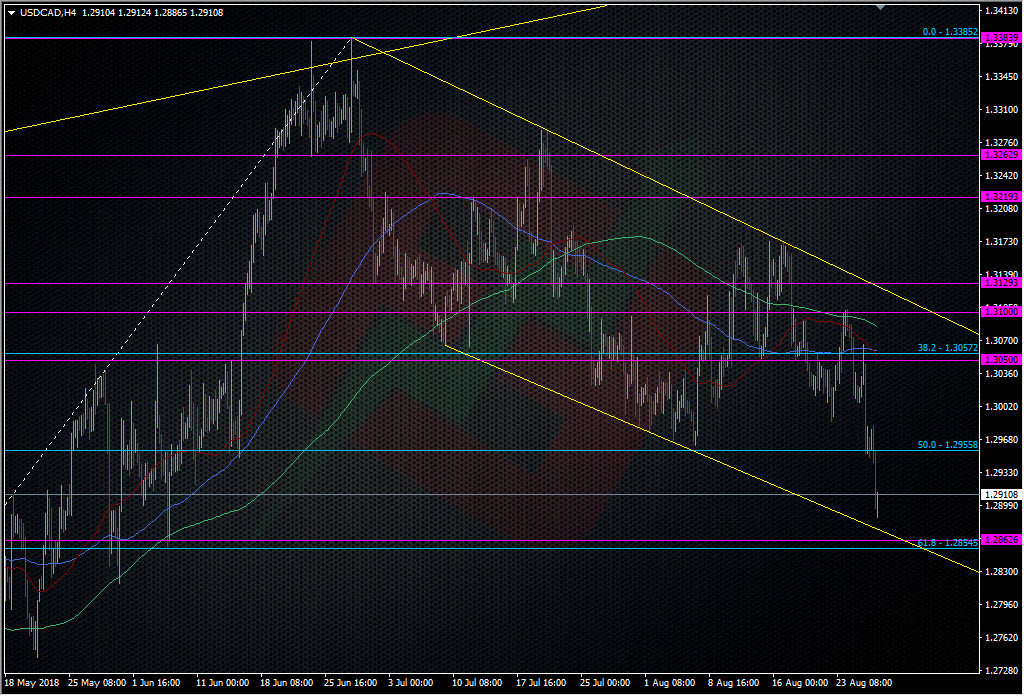
USDCAD H4 chart
So, we’ve gone from a very good technical move at the top, to a potential test of the bottom of the downtrend. That comes in at around 1.2870 at today’s money. There’s a bit more support down there two by way of the 61.8 fib of the Apr 2018 swing up at 1.2845, and old S&R level at 1.2860/65, and we have the 200 DMA just under all that at 1.2844. Lot’s in the mix that makes a long look enticing.
All that said, with a possible NAFTA deal on the cards and only a week away from the next BOC meeting, longs might face a hard time of it. Still, the tech is nice and tight so there’s a low risk opportunity to play the tech.
If I don’t fancy a long from there with all the possible news about, I would be more interested in yet another (larger) channel bottom from 2017.
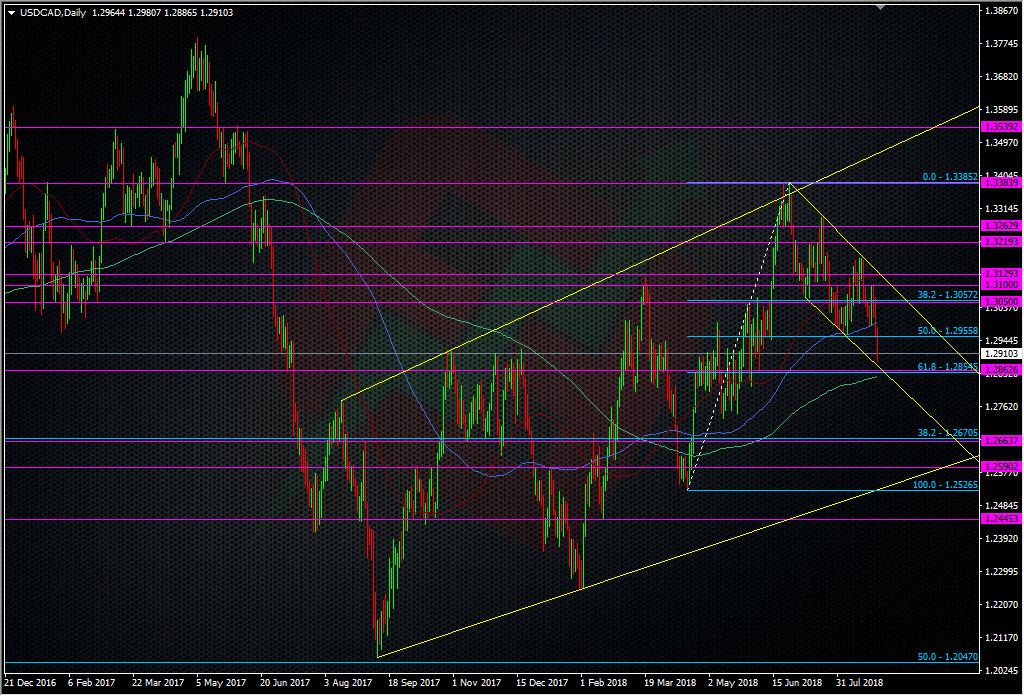
USDCAD daily chart
At around the low 1.25’s, that might just be a better point for the price to ride out any NAFTA news and a BOC hike/further hawkishness.
As always, lots of places to watch for a trade.
Philosophy: “Don’t be a Dick for a tick”
Read how Ryan got into trading here
- The last NFP competition of 2022 - December 1, 2022
- Will this month’s US NFP be a horror show? - October 4, 2022
- US NFP competition – Do you think there’s going to be a turn in the US jobs market? - August 31, 2022
Looks a lot like my charts late last night…. cough cough ;-D