A trading preview of the September 2017 FOMC
It’s to the US we head and the Federal Reserve fo rthe latest monetary policy meeting. Let’s start with they key things to watch.
- The decision itself
- The new forecasts
- The dots
- The balance sheet run-off
Let’s get the easy part out of the way first.
The decision is unlikely to be anything much. We’re only three months away from the last hike and the Fed will be in no rush to raise again, and most of the markets attention is on the Dec meeting.
The new forecasts will get a lot of scrutiny to see whether there’s any reductions in the economic numbers. Even though CPI is running up close to the 2% mark (1.9% CPI, 1.7% core), the Fed’s preferred measure of CPI, PCE, is currently running at 1.4% for both PCE and core PCE. That’s under the median 2017 Fed forecast of 1.7% for PCE, and 1.6% for the core, and also the central tendency range of 1.6-1.7% (both PCE & core). Between those and adding in the higher CPI numbers, the Fed may well keep those projections unchanged and thus preserve any thoughts of another hike this year. If they are lowered then the dollar could suffer as traders write down their hike estimates. The 2018 forecasts could well be where we see the biggest changes, and they will be lowered rather than raised. Again, if that happens it’s going to have a repricing effect in USD against prior hike estimates.
Here are the current forecasts from the June meeting.

US Fed forecasts June 2017
For the rest of the numbers, the labour market is still strong so we shouldn’t expect, nor the market be bothered with any minor changes, if there are any. For GDP, the Fed is one central bank that is actually in danger of hitting its target so again, there may not be much change to these numbers.
Any news on the balance sheet could bring another kneejerk move in the buck. Knowing the Fed, and how they’ve acted thus far, my guess is that if they do announce anything, it’s going to point to a long, slow and drawn out affair. However, none of this should be a surprise or unexpected. The Fed has already been running their various programs in readiness to drain the balance sheet so there really shouldn’t be a big market reaction. However, in trading, it pays to expect the unexpected.
On to the dreaded dots.

US Fed dot plot June 2017
Let’s make this one easy. If we see any of the dovish four or more central 10 step up a line, the dollar is likely to jump as that will cement thoughts on another hike this year. 2018/19 shouldn’t see too much action but look for a lowring of any forecatsts there. While that doesn’t lessen the chances of hikes so much, it does flatten the expected a bit more.
That’s the guff out of the way, let’s get down to the most important aspect, how to trade it all.
The most we should expect from this event is kneejerk reactions to the statement, forecasts, dots and balance sheet. The Fed is well on the path to normalisation and we’re not in a situation where hike talk sends the dollar to the moon. September has seen USDJPY recover from testing the lower end of the 2017 range, and the trend this month is higher. However, unless we get a super hawkish FOMC it’s hard to see the buck gain significantly over this, and for aprolonged period of time.
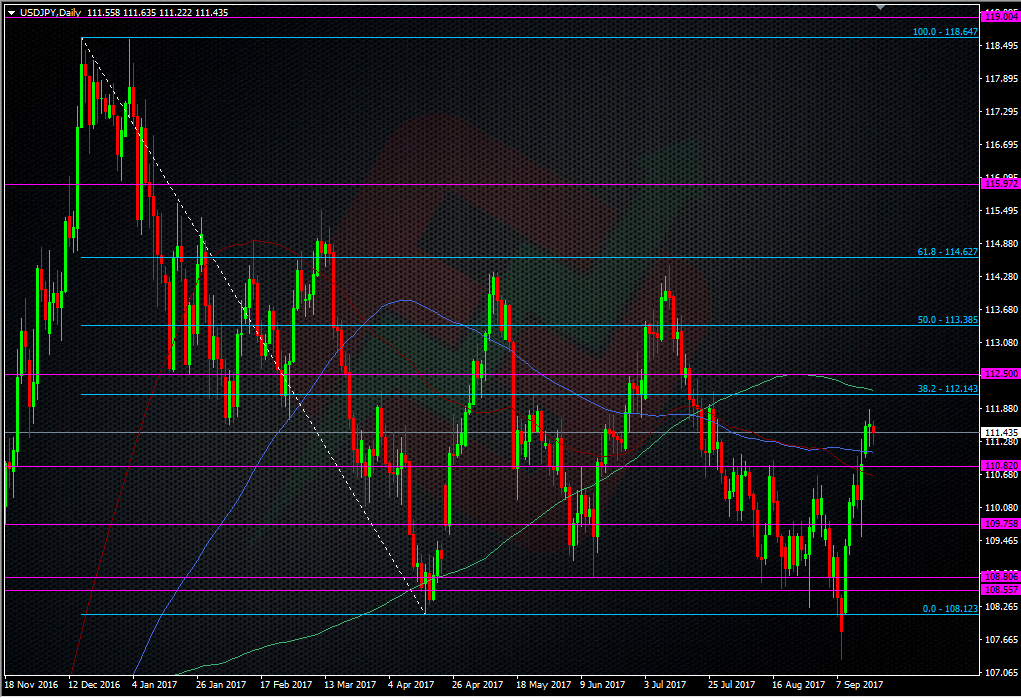
USDJPY daily chart
The 112.50 level is wone I’ve mentioned in many posts these last two years and that woul dbe my choice level for any jumps in the dollar tonight. Should we do overcome that level, that could indicate a run towards the 114 highs and strong double top around the 61.8 fib of the 2016/17 swing down.
If the market feels let down by anything today, certainly 111.00 will get a look but support around the 110.80 level may be strong enough to contain that. Under there we have minor levels at 110.65/70, 110.40/45 and 110.20/25.
If there’s one pair that might be worth trading over USDJPY it’s GBPUSD. A hawkish Fed may send cable lower, and against its current up trend. That might present a good opportunity for a fade if we see a drop hold around either 1.3500 or down towards the recent lows around 1.3465/70.
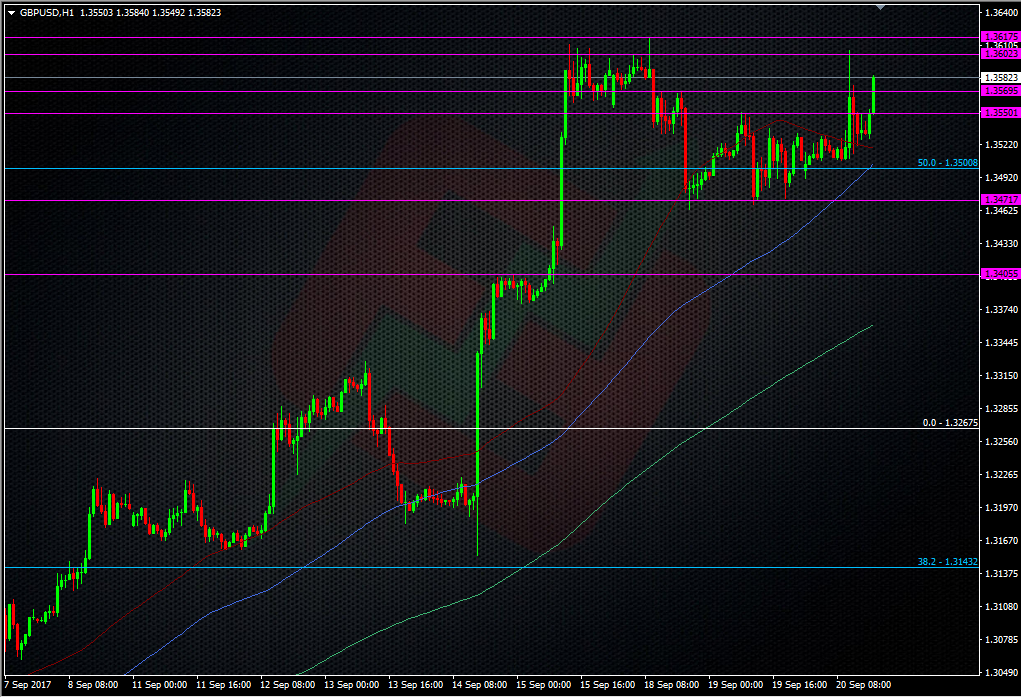
GBPUSD H1 chart
The cable trade is going to be my preferred strategy today as I don’t see any real value in USDJPY, unless we touch one of the levels I’ve mentioned, so I’m going to place some small bids in at 1.3510 and 1.3480 close to the announcement. I’ll have a privisional stop under 1.3450.
The FOMC is followed by a press conference with Aunty Janet and we’ll have a live link for you a bit later.
If you’re trading this one, I hope you make tons of pips, or lose very little.
Philosophy: “Don’t be a Dick for a tick”
Read how Ryan got into trading here
- The last NFP competition of 2022 - December 1, 2022
- Will this month’s US NFP be a horror show? - October 4, 2022
- US NFP competition – Do you think there’s going to be a turn in the US jobs market? - August 31, 2022
Great stuff as always Ryan. Good balance
Great stuff mate