
USDJPY sagging but it’s all down to the dollar this time
Yesterday yen buying and then the Chinese news helped send USDJPY down to a low of 111.27, and we’re not far from there now, with a low put in at 111.32.
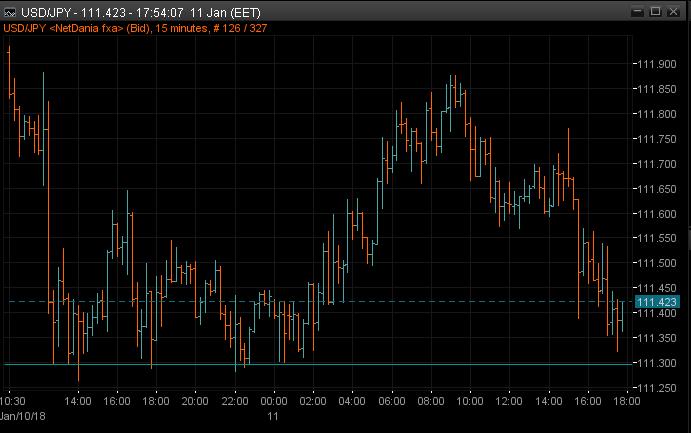
USDJPY 15m chart
There’s nothing that stands out at this level bar it being around the old 38.2 fib of the Aug 2016 rally. I’m not one to take too much notice of old fibs, and we’ve only seen fleeting moments when this area has been S&R. Still, ours is not to reason why, ours is but to sell or buy.
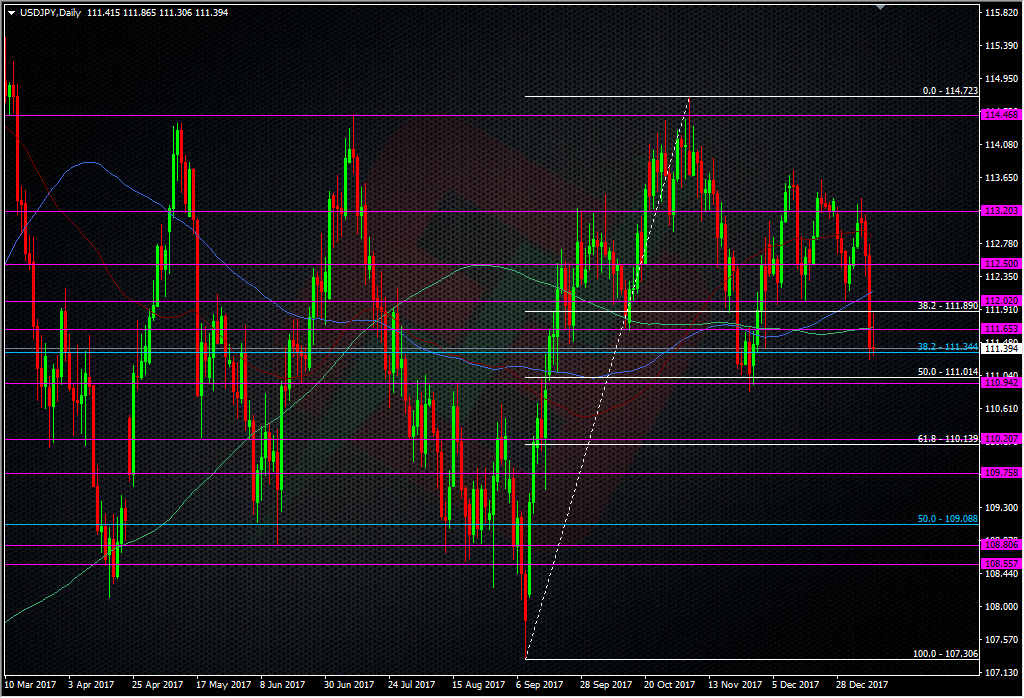
USDJPY daily chart
The 111.30 level could become important short-term if we see it hold again. That would suggest that we have a strong bottom in place meaning we should get another run up towards 112.00. For today, the intraday range has moved from 111.55/80 to 111.30/55, and like that level, traders just need to go with the flow.
Philosophy: “Don’t be a Dick for a tick”
Read how Ryan got into trading here
- The last NFP competition of 2022 - December 1, 2022
- Will this month’s US NFP be a horror show? - October 4, 2022
- US NFP competition – Do you think there’s going to be a turn in the US jobs market? - August 31, 2022
Thx Ryan.
Second time dipping its toe in the water. Interesting..