
As USDJPY takes a another leg lower, we’re heading towards the bottom edge of the 2017 range
If there’s one thing that 2018 has kicked off with, it’s range breaks. USDJPY is heading for one too at its current rate. The break of 110 looks to be a very significant one, and one that puts the price close to the lower end of the 2017 range.
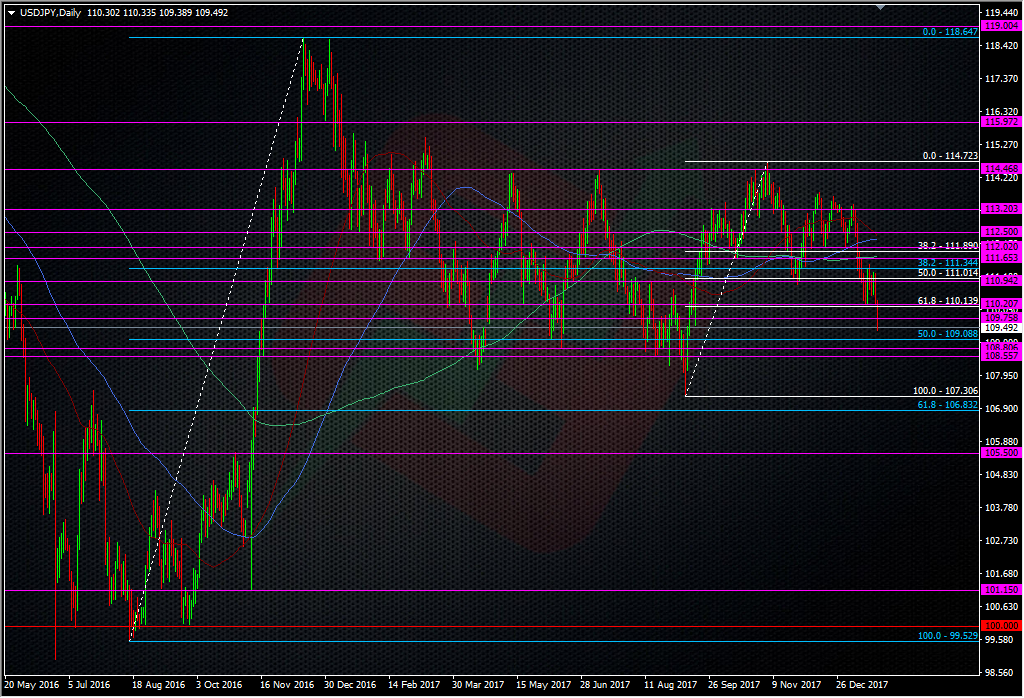
USDJPY daily chart
The break so far has been more of a slow bleed than a quick straight line down, and we previously mentioned that there was institutional buying interest under 110 if it did break, so we could be seeing that in play now. The 109.00 area is going to be important too but it’s the 108 area we should be concentrating on. That’s the real bottom of the range and a move to there is going to be a key test of the bearishness were seeing right now. The area isn’t as clean looking as the topside but it’s still significant.
What’s the trade?
Short-term, the low 109’s is where we’re likely to see some good support, so shorts may want to think about taking some profit if support looks strong. Those looking to fight the trend could look at tight longs, with a view to a quick reverse if it breaks (watch out for 108.80 as a halt point if it does). Ultimately, having some patience to see if we get a move into 108 might be more rewarding. From 108.50 down is where I’d expect to see any good support coming in. Once again, the area might be one where shorts look to take some profits off the table in case we do find a bottom. Buyers can have a go catching the knife down to 108.00 but break there and we could be faced with a swift move that could quickly see us testing the Sep 2017 lows.
The dollar remains in a lot of trouble but in the bigger picture, there’s nothing to get alarmed about unless we see the 2017 range break. For now, 110.00/10 is the main target to overcome to stop the rot but there’s intraday resistance around 109.75/80 to deal with first.
Philosophy: “Don’t be a Dick for a tick”
Read how Ryan got into trading here
- The last NFP competition of 2022 - December 1, 2022
- Will this month’s US NFP be a horror show? - October 4, 2022
- US NFP competition – Do you think there’s going to be a turn in the US jobs market? - August 31, 2022
As usual, brilliant post Ryan.
I have been looking at this chart since the beginning of 2018. There is no reason to discount another quick ‘doctor’s visit’ near 100, I do fail to see a break below the 101 handle. Also, I got called a ‘dinosaur’ the other day so I am not sure I see an inverse Head n’ Shoulders down there. Do you see it too or it is just me getting old?
USDJPY Monthly
https://uploads.disquscdn.com/images/fcde2391681c1666a34a89561c947d3a7c98feb6f7121680babe975276076c3b.png
Hi Jose
The great thing about this pair is that it shows some very clear and clean technical areas. As you say, a move down to 100 cannot be ruled out but there’s a lot of work to be done first. 108.50/00 is a very big level here. Hold that and we remain in range and the traders will stop feeling nervous.
As for head and shoulder patterns, I don’t use them myself. I actually think it’s a pointless indicator but each to their own 😉