
Betty is back ripping faces off
I am not going to flower this up with fundamental fancifuls and technical twists. Just good old- fashioned basics, of both. The charts are below. After a stellar run up in the seemingly never ending USD story, Cable is taking full advantage and so have we at ForexFlow. Betty is not the only game in town, but she has been the most compelling by a country mile, neck and neck with oil for some of us.
Let`s cut to the chase:
The hourly chart below shows a 74.6fib. Important? Yes! It is the 74.6fib of the Brexit decline and where we take a pre-ECB breather today in a well structured market run-up. Cable, some would say, needs to take an intraday breather or 2 at this stage. Not because it is overbought and the USD is oversold, but because the ECB is in the way. Simple as that.
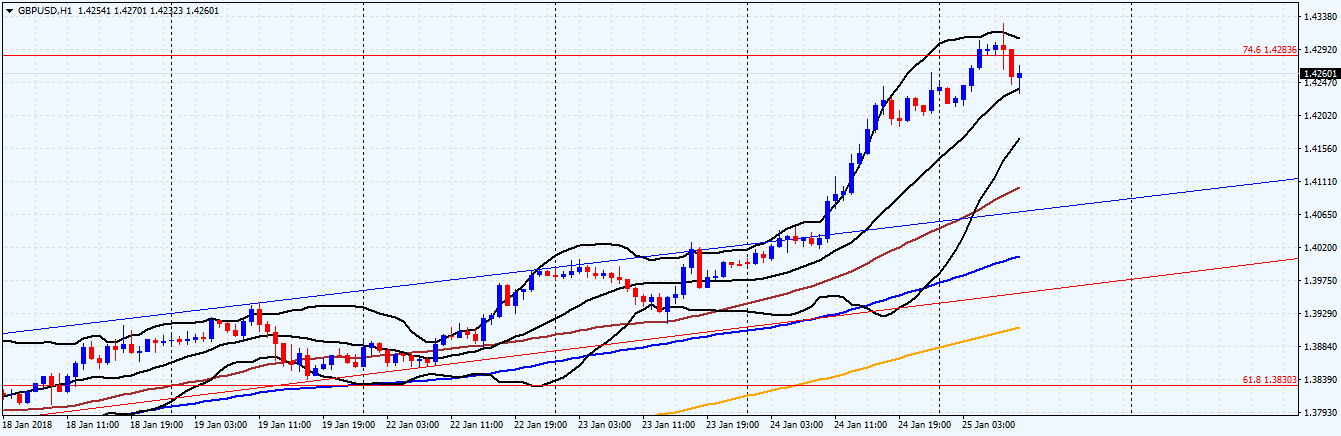
GBPUSD H1 chart
Now that the fib mentioned is toasted, cut to the weekly chart where you will see the orange 200 week standing 1.43987 on my timeframe.
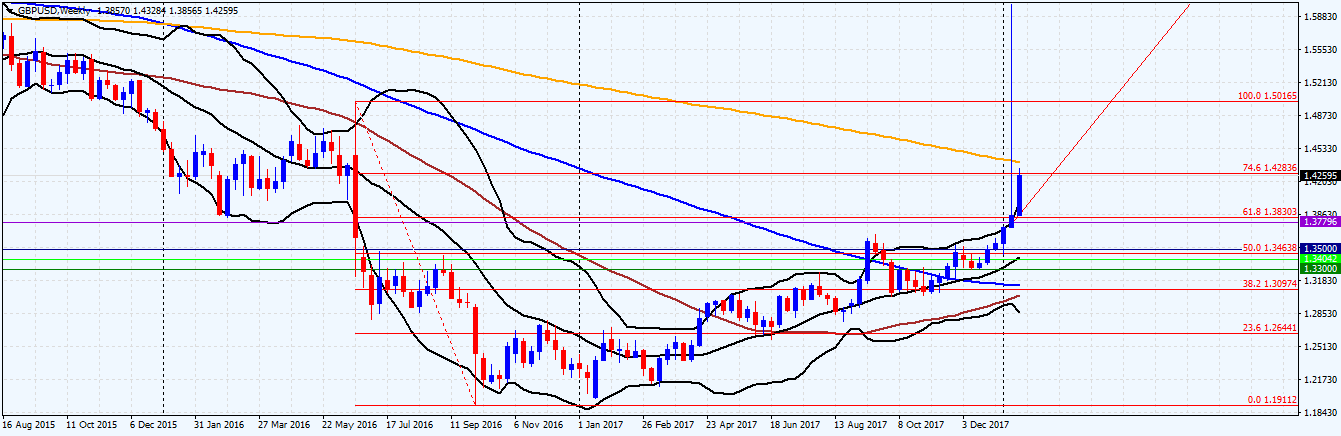
GBPUSD weekly chart
Price needs to close a daily above that MA to then go onto toast the psychological 1.45 and 50 fib of the 2014 to 2016 decline shown clearly on the monthly chart.
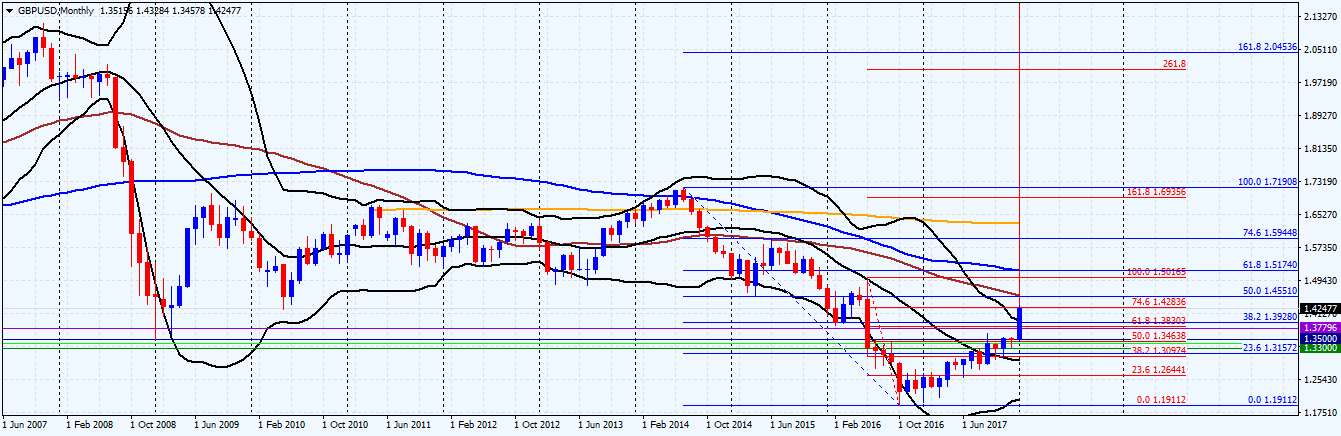
GBPUSD monthly chart
The 200 weekly converges with another roadblock, the 50 month. It is fair to assume that some consolidation will take a hold there. We said that down at 1.35 and then 1.4. Still a USD story and the USD has a fair chunk of downside coming still. We can head for psychological 1.5 as Brexit fears continue to unwind and the USD continues to shed its old skin.
UK Brexit Secretary, David Davies is due to unveil the UK Transition Period plan tomorrow 26th. A seminal moment for investors and UK business. If they like the detail, the Brexit decline can unwind fully.
As in all things trading, nothing is straight forward, yet compelling arguments for against all odds opportunities are always out there somewhere.
First, the ECB.

- Why is the Buck so strong? - May 2, 2018
- What have we on the board today? - April 18, 2018
- A time-tested strategy for account management - March 19, 2018