There’s often a familair pattern seen around FOMC meetings
If there’s one thing that being glued to trading screens is good for, it’s seeing patterns. Over the last couple of years, one pattern has been to see USD strength in the days leading up to an FOMC meeting. With the dollar under the cosh of late, there’s a possibility that we’ll see the same thing happen into Wednesday’s meeting as traders set themselves up ahead of it. If the dollar does start to find a bid, traders need to factor that it might be an FOMC move into their equations, rather than thinking it’s more of a meanigful turnaround in the dollar.
What too look for and how to trade it
Like most things in trading, it’s not an exact science but it’s important to be aware of what could affect prices. As the discalimer in most financial services says, past performance is not an indicator of future performance, so we might not see anything but if we do, we need to keep a close eye on it. First things first, there’s no action expected at this FOMC so all the focus will be on whether the Fed maintains their language and own expectations for the path of hikes. That might reduce the size of any pre-FOMC gains in USD as expectations will be set pretty low anyway. There’s also bigger fish being fried in USD than what the FOMC is doing, as the bond sell off continues.
As is ever thus, let the charts do the talking. I’m not expecting to see a huge rise in the buck on this but at the very least, I’m expecting to see the support below perhaps hold a bit more than it might have last week.
The 108.50 level is one area that looks pivotal. Holding above, and we go up. Hold below and we go down. I mentioned last week that USDJPY around 108.50 was a potentially defining level but with the caveat that’s it’s a bit of a messy area down there. The support of the 2017 range isn’t as clean looking as the resistance is up top. anyway, we’re above 108.50 and finding support in front of it around 108.60. The next focus is on the 109 area that’s offered resistance today. Break that and we’re on for a move to the next intraday resistance levels 109.50/60 and 109.75/80.
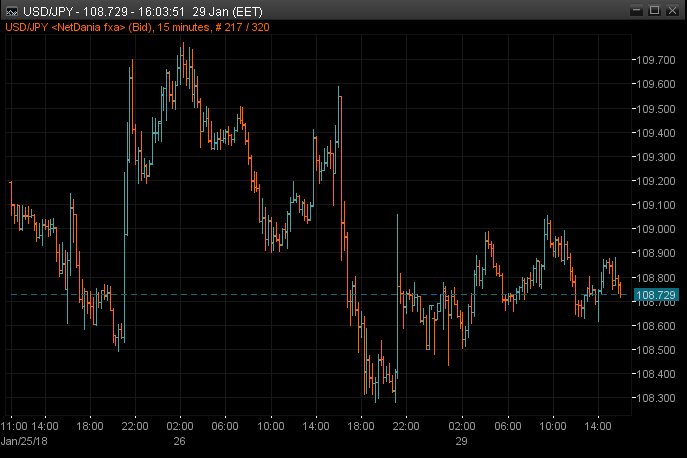
USDJPY 15m chart
There’s several ways to trade this. If you’re long from down below already, use any USD strength into the FOMC as a means to lock in some profits. A trailing stop would be the best plan, as you can cover all angles. If we do get a USD lift and it’s just FOMC noise, you’re protected from a reversal. If any USD strength is something more, well, you’re on it for the ride. If you want to get long, again, feed off the 108.50 if it holds firm.
Shorts from above have a potentially tought decision. If 108.50 is tested and holds, that might be a signal to take some off the table. and then perhaps look to reload shorts at better levels. New shorts might want to try some patience to see if the dollar does run higher into the Fed, and then look to lean on the good resistance areas during/after.
For both longs and shorts, it will be time after the FOMC that will be crucial. If the recent moves after FOMC meetings so hold true, there’s a very good chance that any USD gains will be sold into and back down we’ll go. Longs will have to be watching their support levels closely. On the flip side, if some of the higher levels get taken out in the hours, sessions, days after, that’s a signal that this phase of the USD selling is possibly over.
We’ll bring you more on the trading levels to watch closer to the event.
Philosophy: “Don’t be a Dick for a tick”
Read how Ryan got into trading here
- The last NFP competition of 2022 - December 1, 2022
- Will this month’s US NFP be a horror show? - October 4, 2022
- US NFP competition – Do you think there’s going to be a turn in the US jobs market? - August 31, 2022