
NZDUSD can’t find a buyer for love nor money but it can’t keep dropping forever. Here’s where we could finally see some support.
If you’ve been trying to knife catch in NZDUSD you’ve probably run out of fingers by now.
There might be some respite coming here at 0.7050/55 and into 0.7030/35.
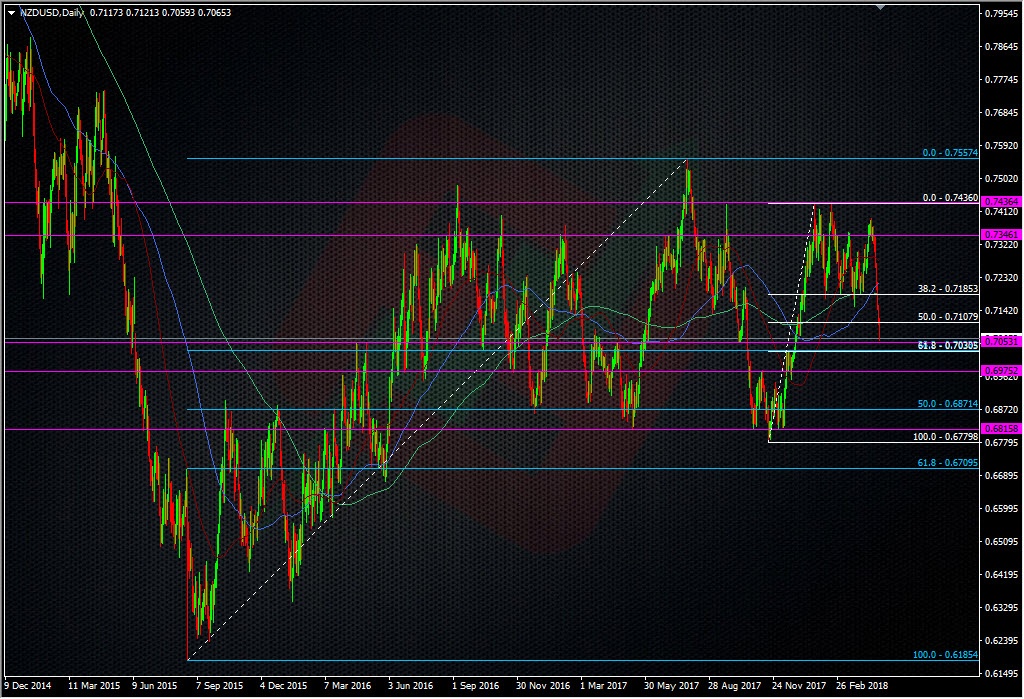
NZDUSD daily chart
The confluence of the 38.2 fib of the 2015 swing up and the 61.8 fib of the Nov 2017 move looks good on a technical basis, and more importantly, offers a potentially low risk trade. I haven’t traded kiwi for a while so have all my fingers, so I’m going to look to buy at 0.7055 and then at 0.7035/40. To lower my risk, I’ll stop half on a break of 0.7020 and then add another long in at 0.7010 to test the big figure, with a stop under 0.6990 on it all.
As we say often at ForexFlow, there’s nothing wrong with fighting a trend as long as you trade it accordingly and keep risk as low as possible.
Philosophy: “Don’t be a Dick for a tick”
Read how Ryan got into trading here
- The last NFP competition of 2022 - December 1, 2022
- Will this month’s US NFP be a horror show? - October 4, 2022
- US NFP competition – Do you think there’s going to be a turn in the US jobs market? - August 31, 2022
Why don’t try EURNZD short? You really like Euro, don’t you Master Ryan:-)
It’s not the euro I like, it’s the fundamental/ECB picture I like 😉
I also like the tech in NZDUSD (which is lacking in EURNZD) and that’s purely what I’m looking to trade. This is a big move down and it will stop at some point, if only temporarily, and if it’s going to stop somewhere, it’s going to be on one tech level or another.
Are you looking at EURNZD yourself?
Can’t resist the temptation, shorted a small size at 1.724 with . I mean stop above 1.733.
Good luck my friend, I hope you bring in those pips.
oh, one more thing Ryan, after recent USD strength, I guess lot of readers wish to see your view about EURUSD/ECB now, do we have the luxury of seeing your view in this regard soon, perhaps after forthcoming ECB meeting?
Sure thing Chen.
i had that idea too, but didnt think about the reducing plan, Thanks
I think it will retest 1.75 and I will sell EUR against NZD ))
Just had a look at 2 weeks chart and looks like it’s the 4th time range trading with bottom 0.6840-30 and top 0.7440-50.
It’s been a solid range. My last analysis was talking about that 0.7435/40 area and I was offered right up at 0.7430 when we looked to be going into into 0.74 but we didn’t get there. Lo and behold, here we are 300 pips south.
The lower bound at the low 0.68’s looks equally good too but there’s work to be done to get there. We’re pretty much in the middle (give or take a few pips) and I really like the tech picture, and the fact It’s quite low risk. Even right now, it’s looking solid in the 0.7060 area (I’m bid at 0.7055). This might just be a pause after another down day but that’s why we look or levels right?
It will bounce 100% in correction wave you’re right but then will down.