
A trendline quandry for GBPUSD
We’ve been discussing trendlines in our trading room today and with GBPUSD taking another leg lower, maybe it’s time to put the question out to a wider audience.
I like my tech nice and clean and as least confusing as possible but the picture in cable regarding trendlines is one of those difficult situations where there’s lots of options. Most in the room agree that when faced with such dilemmas, looking for confluences with other indicators, on the same or different time frames, can help you sort the wheat from the chaff.
Here’s the weekly cable chart. Tell us what you see and how you would play it?
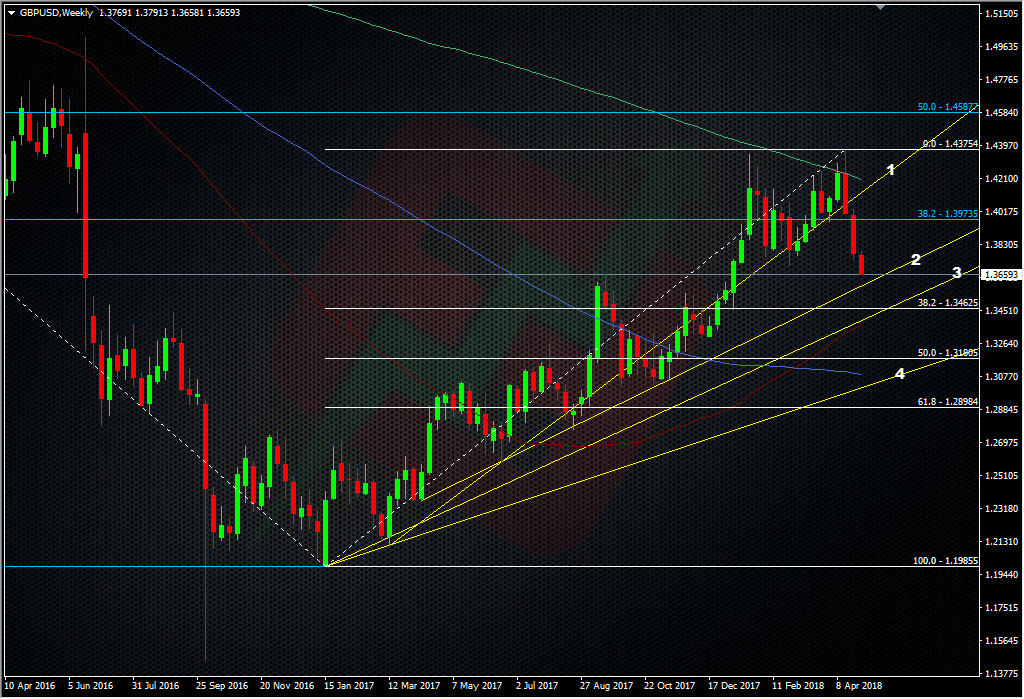
GBPUSD weekly chart
Let us know in the comments below.

Psychedelic chartist extraordinaire. Have your shades ready.
Philosophy: “Don’t be a Dick for a tick”
Read how Ryan got into trading here
Philosophy: “Don’t be a Dick for a tick”
Read how Ryan got into trading here
Latest posts by Ryan Littlestone (see all)
- The last NFP competition of 2022 - December 1, 2022
- Will this month’s US NFP be a horror show? - October 4, 2022
- US NFP competition – Do you think there’s going to be a turn in the US jobs market? - August 31, 2022
Basically, I draw all those that I believe might have a significant role as support/resistance. And treat them as possible support/resistance, as one would do with Fib, MA etc.
The key to me is try to understand which one to mkt is focusing at the moment. Then if it’s gone, move to the next one that is becoming a focus for the mkt.
Well, good post and good point to discuss. Indeed, there would be a lot to discuss in this regard, channels and trendline ;-))
Treating them all separately is one way to play it Magics,.
Tough question, against line 2 I think, must hold it, quaterly chart is on up trend, MACD is up.
I think it’s deep correction. Why don’t you use any tech indicators like RSI, MACD?
My chart soft paints support line at 1.3650
I don’t personally believe in oversold/bought indicators like RSI’s because you can’t physically lean on a price like you can with a trendline. Over bought/sold only happens when the market decides it has done enough/buying or selling, not because some indicator says so.
I understand how it can be used to gauge possible bias but picking your spot to trade on it isn’t easy. Like most tech, if it works for the user then that’s what matters.
short the pound
short the pound
https://charts.mql5.com/18/175/gbpusd-w1-safecap-investments-ltd-3.png
short the pound
Good luck FXJ. Long way to go to get there though.
it is a weekly chart and of course a lot could happen in the meantime to make it turn higher but at the moment I am short the pound – I trade the hourly M15 and scalp mostly
? I’m with you on that longer term FX Johnners .
A little bounce from here perhaps ?
Super stuff as always my friend
The little bounce did not last too long – if it can edge below the low of early this morning next stop could be 1.35
Personally. I will not accommodate a ‘trendline’ unless it has more than 2 touches.
I like FX Johnner’s weekly line . Also like Ryan’s No 2 line.
It all comes down to which timeframe you watch and trade from. A trendline on a 15m chart may not be visible on an H4 .Guys working from 15 min’s must have different profit goals ( unless they are hoping to be top/bottom pickers ) than those using H4 – Weekly