
USDJPY is approaching some stiff resistance – Forex technical analysis
The upside in USDJPY has been a big discussion in our trading room today and there’s a lot to be considered on the upside.
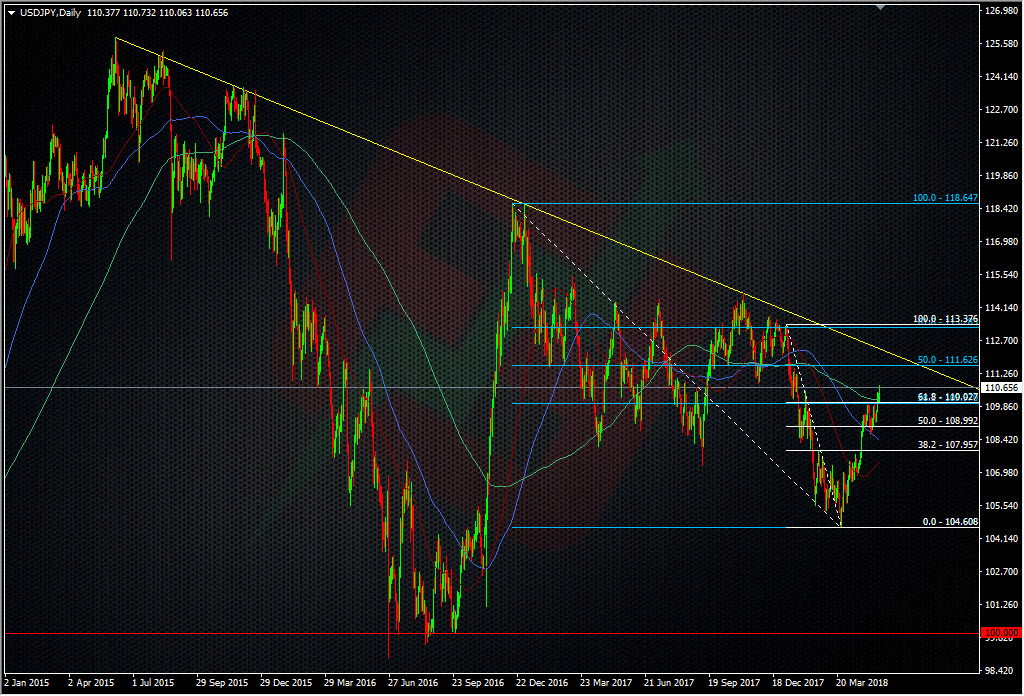
USDJPY daily chart
From the mid-111’s to the 113’s it’s busy with levels. The 55 MMA also sits at 111.30 currently, and Kman notes the bottom of the weekly cloud at 111.90. There’s lots to chop though but this pair has history in chopping slowly though the tech. The 55 WMA was helping add to the resistance picture at 110.50 and now we’re above, it’s going to be a consideration if we come back down. That support is likely to continue into 110.40, the area that held so well yesterday on the way up.
This pair still feels like a bit of a bystander to everthing else going on, as it’s been holding tight trading ranges while other majors and crosses are running around like headless chickens. Slow and steady makes for good trading opportunities as the lower volatility means there’s lower risks when trading it.
I’m still long from the 110 break and remain a dip buyer. As per our daily trading ideas post (GWTF) earlier, I’ll look to take some further profit if we see a move into 111, and I’ll probably have a separate big fig scalp, depending on the conditions. I’ll also look to add to the long on a break.
Looking at the bigger picture. The big old 114/115 resistance area is still the main place to watch and one where I would consider turning back to a seller. That’s one for the back burner and we’ll judge the reasons why it goes there, if indeed it does.
If you’re watching any levels here or above, feel free to throw them into the mix in the comments below.
Philosophy: “Don’t be a Dick for a tick”
Read how Ryan got into trading here
- The last NFP competition of 2022 - December 1, 2022
- Will this month’s US NFP be a horror show? - October 4, 2022
- US NFP competition – Do you think there’s going to be a turn in the US jobs market? - August 31, 2022
As I said in the liveroom , I’m small long again. Started as a scalp to try and make my EURNZD stop money back. My next thought is, despite risk off news, USDJPY seems immune due to higher rates, higher energy prices, higher Nikkei. There was a good chance yesterday to get it back sub 110 when the crosses got sold off ,but it held rocksolid.
I took smalls off the longs just to respect the 75/85 resistance but will be running a long as long as 110 holds. The weekly cloud bum raised this week up to 111.90 and the resistance line in the 112.20s is becoming a reasonable target.Fibs in the zone too, actually to many to put up on one chart.
There are indeed some speedbumps on the way up but King dorra still feels strong across the board.
Tonight’s CPI could decide upon a few things, especially if we confirm last month’s stalling numbers.
https://uploads.disquscdn.com/images/565f851e880aae9e06326c30e2b69ebc4060880a97a405cf8dd94fea61b13350.png