The fibs show that GBPUSD has lots of work to do to turn the trend around
Yesterday I wrote a post about finding clarity in the EURUSD moves and how the fibs can play a big part in removing the confusion. GBPUSD is another pair that has fib action playing in two trends.

GBPUSD daily chart
Like the Euro, we’ve seen the price stall someway above the 38.2 fib of the post-Brexit rally but as you can see from the chart, we’re a galaxy away from the 38.2 fib of the recent downtrend. What I don’t like about this pair compared to EURUSD is that the S&R levels aren’t nice an clean. Remember the ’30’s’ I highlighted yesterday? There’s not really anything like that in this pair. What levels do stand out have various spikes just above/below. We can’t expect a perfect world in any tech but the cleaner an S&R level looks (i.e price action stopping pretty much dead on it) the better it looks to trade. When that doesn’t happen it shows a lot of indecision and lack of control in a market. The battles are messy and traders are unsure. That’s been pretty symptomatic of Brexit trading in its entirety, and one reason I haven’t been to keen to trade it. There’s just too many unknowns and out of the blue price moves. It’s still a higher risk pair to trade.
Pretty much the only stand out levels here are around the 1.3450 to the old 38.2 fib at 1.3462, Aside from that, I would really only look to the big figs for a trade as we know we’re likely to get some action there.
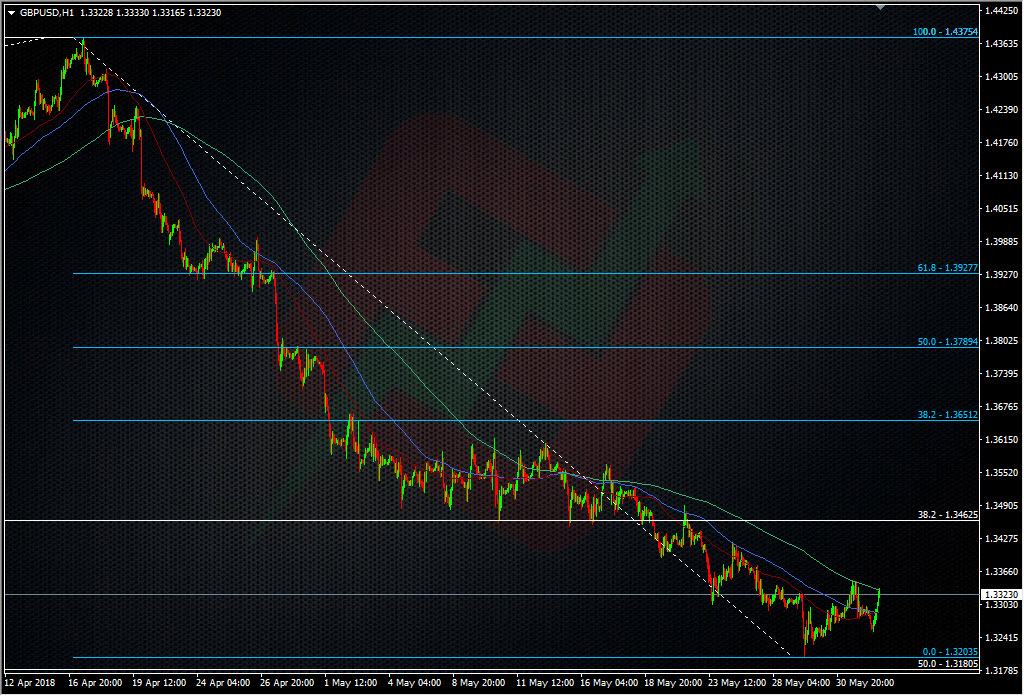
GBPUSD H1 chart
For the downside, the 1.3250 low yesterday should be a consideration and then the low 1.32’s again, with a view of that big fib at 1.3180. That looks to be a low risk opportunity for a long with a stop just under. For me, trading cable needs plenty of patience and picking out the wider levels that look strongest. Anything in between is more for a scalp strat off the ontraday levels that develop. over these last two days, that’s pretty much 1.3250-1.3350.
Philosophy: “Don’t be a Dick for a tick”
Read how Ryan got into trading here
- The last NFP competition of 2022 - December 1, 2022
- Will this month’s US NFP be a horror show? - October 4, 2022
- US NFP competition – Do you think there’s going to be a turn in the US jobs market? - August 31, 2022