There’s an important signal in the charts and here’s what it is
Here’s the question again: What’s so special about these charts?
It’s good to see you folks are on the ball.
The answer to “What’s so special about these charts?” is that the price action from the big events last week couldn’t break the prior big lows (from May). Here’s the charts again;
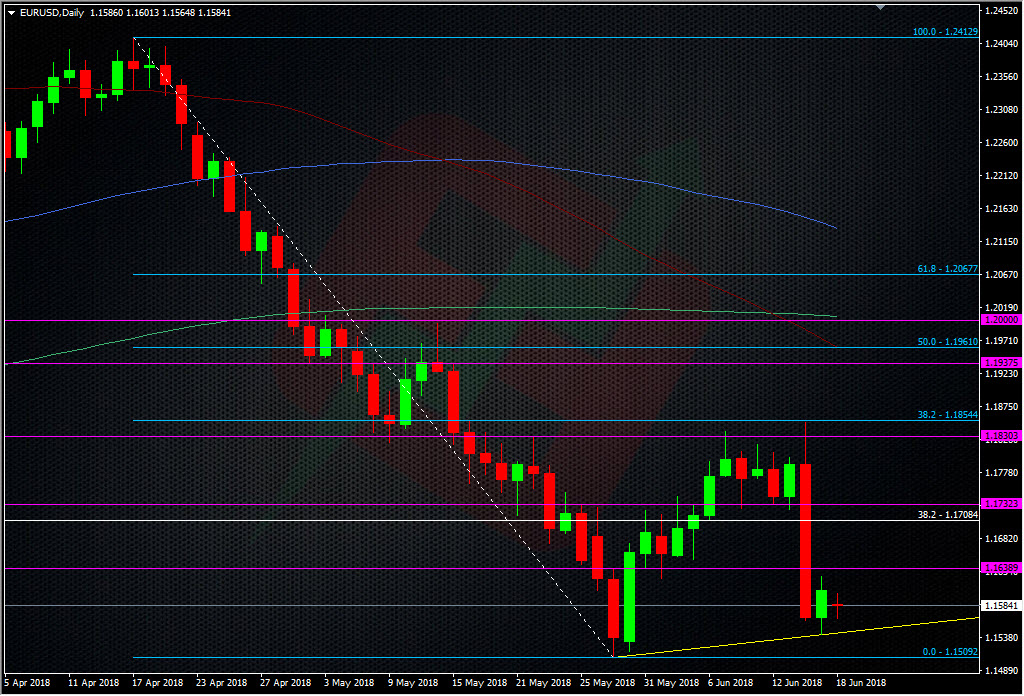
EURUSD daily chart
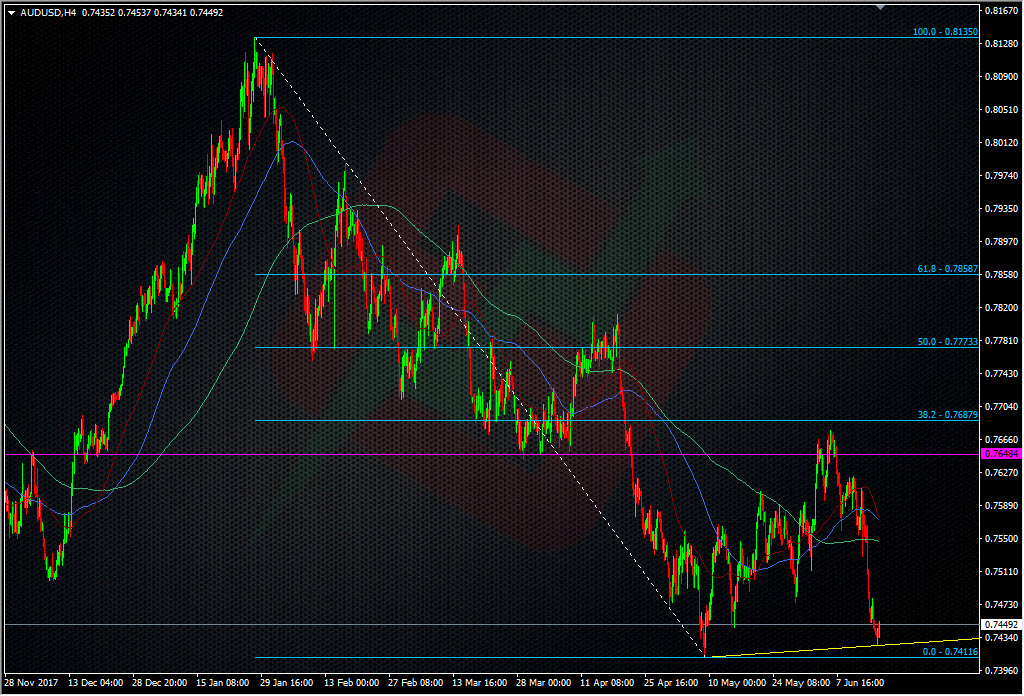
AUDUSD H4 chart
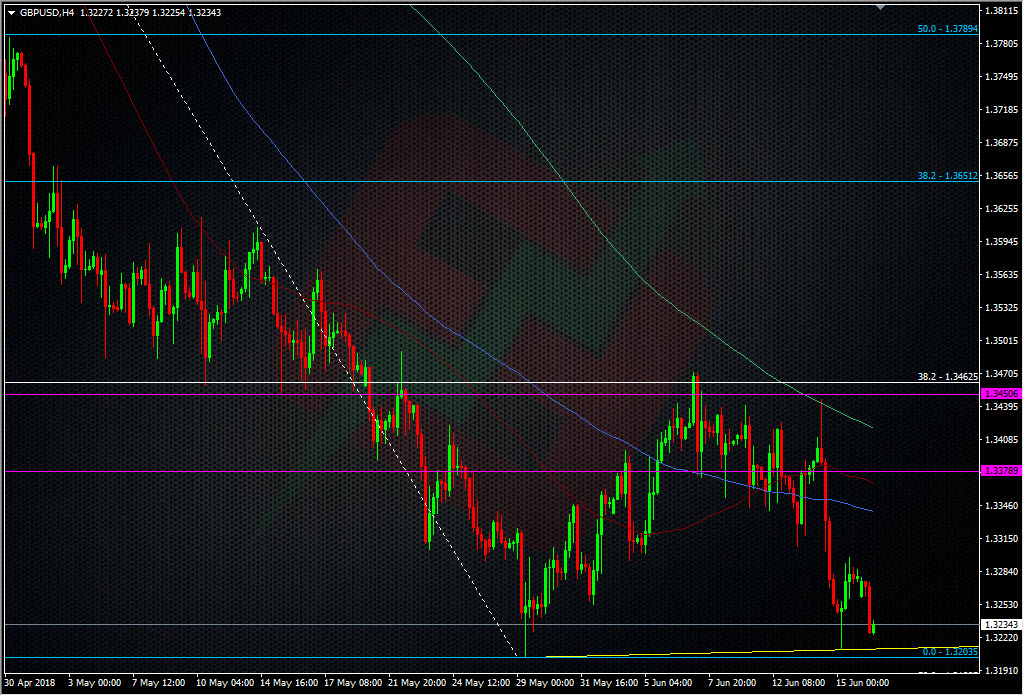
GBPUSD H4 chart
Almost like for like we found support on USD strength ABOVE the prior lows in May.
Why is this important?
When looking at wider levels or higher time frames I look for what I call “stepping” action. It’s when we see a price test a former low (or high) but it doesn’t quite get there.”Stepping” can come in many different forms, on many different timeframes and at many different speeds. One example is the GBPUSD chart above. You can see the price step up from the May low with higher highs and higher lows. The stepping I’m looking at today is slightly different because it follows a longer period of time that’s passed, has happened after we’ve already had a decent move and after some huge events.
Let’s look at the EURUSD chart. We’ve already had a big move in from the May low and the test of that move has happened last week. What we saw was support stepping in ahead of the May lows to protect those lows. That tells us two things initially.
- Longs from the May lows are still intent on buying down there, and they want to protect those lows
- Sellers weren’t strong enough to test the May lows
What does that tell us for trading?
Firstly it gives us two views of market action. Secondly, it gives us two levels to watch/trade. Last week’s low is point A as that’s where the buyers have set their stall out. The May low is point B as that’s effectively the line in the sand for those longs. The market has come though the ECB giving a dovish taper and a hawkish FOMC, and yet those May lows couldn’t be broken. It’s a sign of strength in the techs.
Does it mean they’ll hold? Does it mean prices will shoot 300 pips higher? No. But, then we never get such guarantees in trading. What we do get is price action that shows that something important is happening at those levels. The euro may very well dead-cat bounce and then crush the lows, or it may test and hold again, or it may keep rising from here. It’s how we decide to trade it that matters. There’s a low risk trade in EURUSD taking longs off the 1.1540 low with a stop under 1.1500. There’s a case to trade it off the trendline. It’s possible we’ve already seen another step up with today’s 1.1566 lows being the step from the 1.1540 lows. It’s all open to interpretation and how you want to define a trade.
Out of the three charts, I’m more confident in seeing a bounce in AUDUSD than the other two as that pair was showing more resillience before it fell. It’s also got a bit less “noise” in it. EURUSD has the ECB, Brexit and trade wars to deal with and the Aussie has some of those but to a lesser extent. GBP is right back in the middle of the Brexit melting pot and so it’s a high risk currency to trade. As such, I’ve gone bid small in AUDUSD at 0.7430 with a stop under 0.7400. I may also add a bit more into 0.7400 to test that level.
This is one of those trades where it’s 90% about the tech and 10% about the fundamental news and events (unless something comes out to change that). With the big central bank news now ‘out there’, it’s up to traders to decide ‘what’s next?’. At the moment, there seems no inclination to push the dollar higher so I’m trading against the levels that have been defined on the charts. That’s what we do every single day. The trade relies on the price restesting these lows from last week and holding. If not then I’ll trade the line in the sand and the May lows.
So that’s my answer to what’s in the charts. I also spoke about it today to the guys at Core TV.
Philosophy: “Don’t be a Dick for a tick”
Read how Ryan got into trading here
- The last NFP competition of 2022 - December 1, 2022
- Will this month’s US NFP be a horror show? - October 4, 2022
- US NFP competition – Do you think there’s going to be a turn in the US jobs market? - August 31, 2022
https://www.tradingview.com/x/UpxBkv4B/ i didnt have this line on the chart last week, actually, only it bounced, then i found it
Ryan good to have you back, hope you had a relaxing break. This is what I have always admired about your commentary, posts – never sit on the fence and take trades in full view of your audience – whether it works out or it doesn’t you and all of the FFL team have my respects. – keep up a the great work!!!!
Hi Tally.
Sorry for the late reply, I had to watch my team struggle to beat Tunisia 😉
Many thanks for your kind words, the team and I appreciate them a great deal.