
Q1 2018 US GDP final report 28 June 2018
- Flash 2.3%. 2nd est 2.3%
- Q4 2017 2.3%
- Consumer spending 0.9% vs 1.0% exp. Prior 1.0%
- PCE final 2.5% vs 2.6% exp. Prior 2.6%
- Core PCE 2.3% vs 2.3% exp. Prior 2.3%
- Exports 3.6% vs 4.2% prior
- Imports 3.2% vs 2.8% prior
Softer. Considering we’re just ending Q2 there’s not going to be too much focus on this data but it is much softer. There’s mixed news in the numbers. A decent gain for business investment, which finished up 10.4% vs the 9.2% estimate, and the 6.4% in Q4 2017. Household investement remained down but at -1.1% vs the -2.0% prior. Government spending was up a touch too.
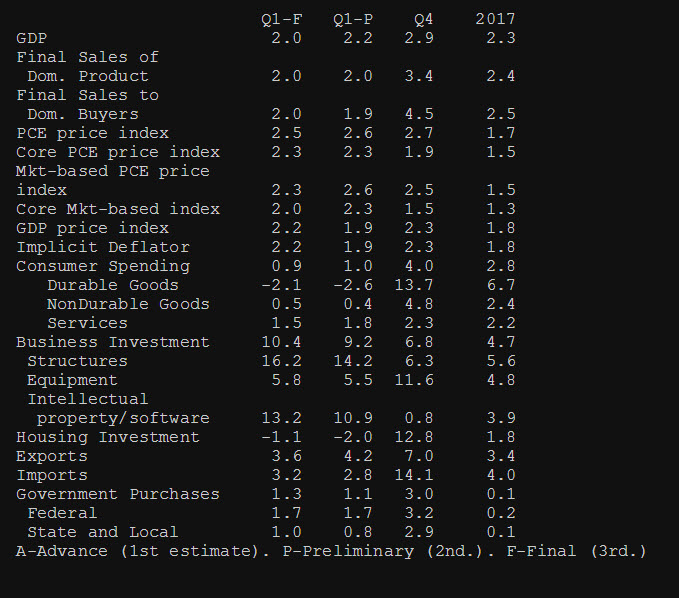
US Q1 2018 GDP details
Psychedelic chartist extraordinaire. Have your shades ready.
Philosophy: “Don’t be a Dick for a tick”
Read how Ryan got into trading here
Philosophy: “Don’t be a Dick for a tick”
Read how Ryan got into trading here
Latest posts by Ryan Littlestone (see all)
- The last NFP competition of 2022 - December 1, 2022
- Will this month’s US NFP be a horror show? - October 4, 2022
- US NFP competition – Do you think there’s going to be a turn in the US jobs market? - August 31, 2022