USDCAD is all over the place
I’m not afraid to admit that this pair has me stumped. It’s up and down on risk, it’s up and down on the trade war and NAFTA stuff, it’s up and down on Poloz, who’s up and down on the hawkish/dovish rhetoric, it’s up and down on oil, when it feels like it.
Well, as we say in trading, when the fundamentals look messy, stick to the techs.
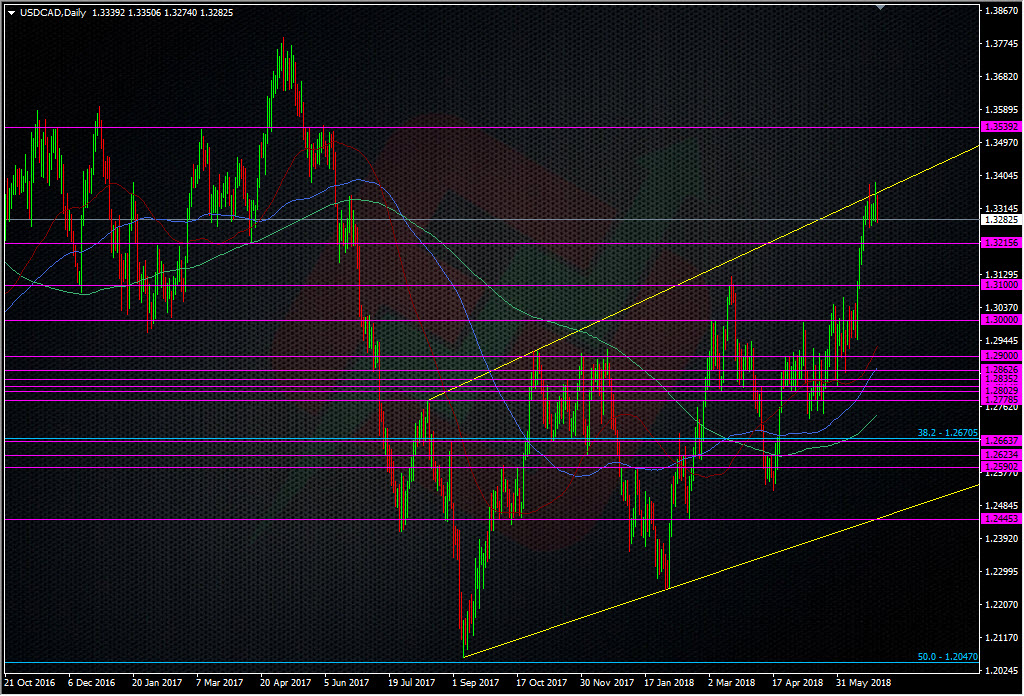
USDCAD daily chart
The techs say sell against the upper trendline. It now also says sell up to the 1.3380 highs or put stops from the trendline just above there (but you could perhaps push the boat out to encapture the big figure at 1.34).
It also says longs might be good down near 1.3260 but will then says longs will be wrong if 1.3260 breaks.
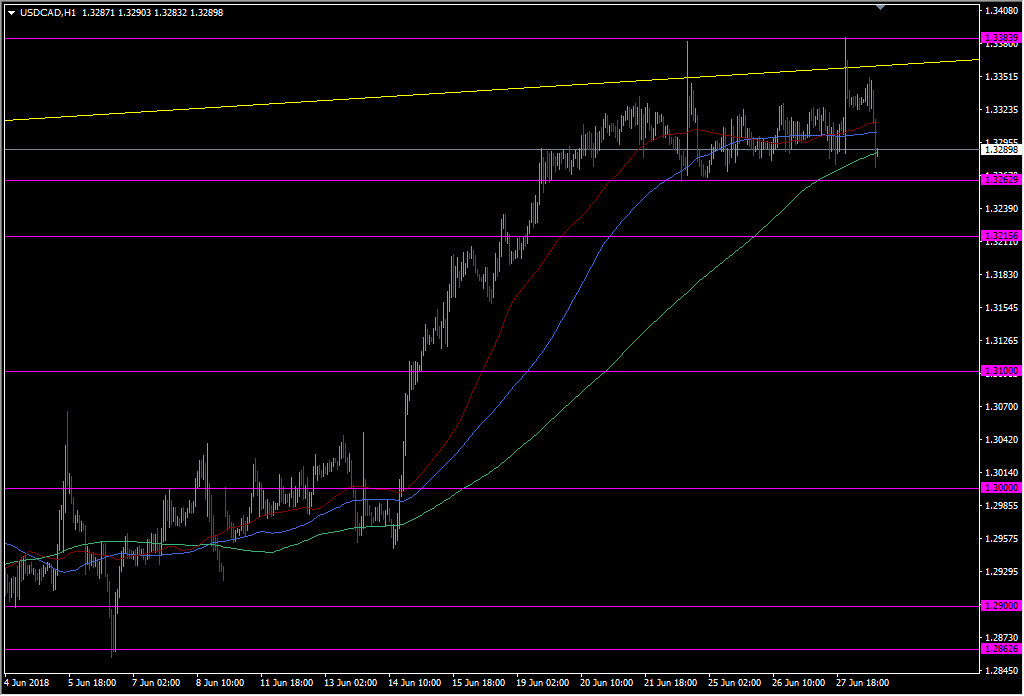
USDCAD H1 chart
If the news or reasons why a market is moving is confusing you then stick to what’s simple. There’s two levels you can trade at here with tight stops and low risk. Why worry about the why’s and wherefores? That’s exactly what some of the folks have done in our trading room today and they’re being rewarded by this move.
Philosophy: “Don’t be a Dick for a tick”
Read how Ryan got into trading here
- The last NFP competition of 2022 - December 1, 2022
- Will this month’s US NFP be a horror show? - October 4, 2022
- US NFP competition – Do you think there’s going to be a turn in the US jobs market? - August 31, 2022
Hey Ryan, I am back. I didn’t do anything but the web gods have allowed me to return. Usd Cad stumping me for a week but still short……it’s is finally behaving
Welcome back Marc, glad it’s corrected itself.
This pair isn’t taking any prisoners at the moment. One minute you think it’s going your way then it turns in a blink.
Nice call Ryan! Sometimes it aint possible to figure out the latest or next move in Cad. There are alot of variables as you quite rightly point out. Some of us just trade it, while others write about it. But I’d rather be right than write.
Looks like we’re trading numbers not currencies, and their relative nuances. It seems like the “narrative” (selling Cad to 1.60) has taken hold. Cad doesnt need an impetus to sell off, when its being jawboned to its death. The tilt comes when 1,000 banks take even a small negative position, then mix in the specs and there you have it. Fundies and techies are superseded by the above. Oh yeah, Cad is always low when Libs in power and the inverse for Cons.
Side note close above 1.3361 is my signal to further weakness.
Hey Kay.
Well said. Perhaps if I had done more looking and less trying to listen I might have been inclined to join some of the other traders who sold up near the highs.
What’s your take for the BOC next month? Hike or not?
Not sure it will matter-priced in. The current negative scenario rules the day. So, dip on a raise and crush if not. Down draft will need a more positive “narrative” to reverse course. These narratives take time to formulate, disseminate and execute. Exporters are thriving(not willing to fully sell into it-forwards- just yet) while importers suffer.
There’s a definitive picture on the option boards too. Very little coverage topside above 1.34 but plenty below. That’s from a picture taken over the next two months.
Lol… Another spec talks the talk:) How’s u long doing?