A look at some of the price levels that might be in play for the FOMC
Time to study the charts and get some levels on the radar.
USDJPY
Up
- 115.50 Break here and we’re in open ground
- 115.00 will be natural resistance
- 114.72 The Nov 2017 high. The porice will need to clear this for a look at 115.00
- 114.00 is going to be a big level and the start of protection of the previous runs into 114.00
- 113.60/75 also old S&R through 2016/17/18
- 113.40 prior resistance area, last in Jan 2018
- 113.20 200 WMA
Down
- 112.75/80 is intraday support
- 112.40 has more of the same
- 112.00/10/20 Expect support into the big fig
- 111.92 55 WMA
- 111.60/70 prior S&R area
- 111.40/45 prior S&R, 111.47 55 DMA
- 111.11 200 WMA and some older S&R and it leads in to the 111 big fig
The key area for this pair is the topside and that big resistance area around 114+. Overall, it’s likely to be a sticky patch for any rally so really, it’s going to take clearing 115.00 to render it properly broken. Failure to do so just keeps the price in the wider range.
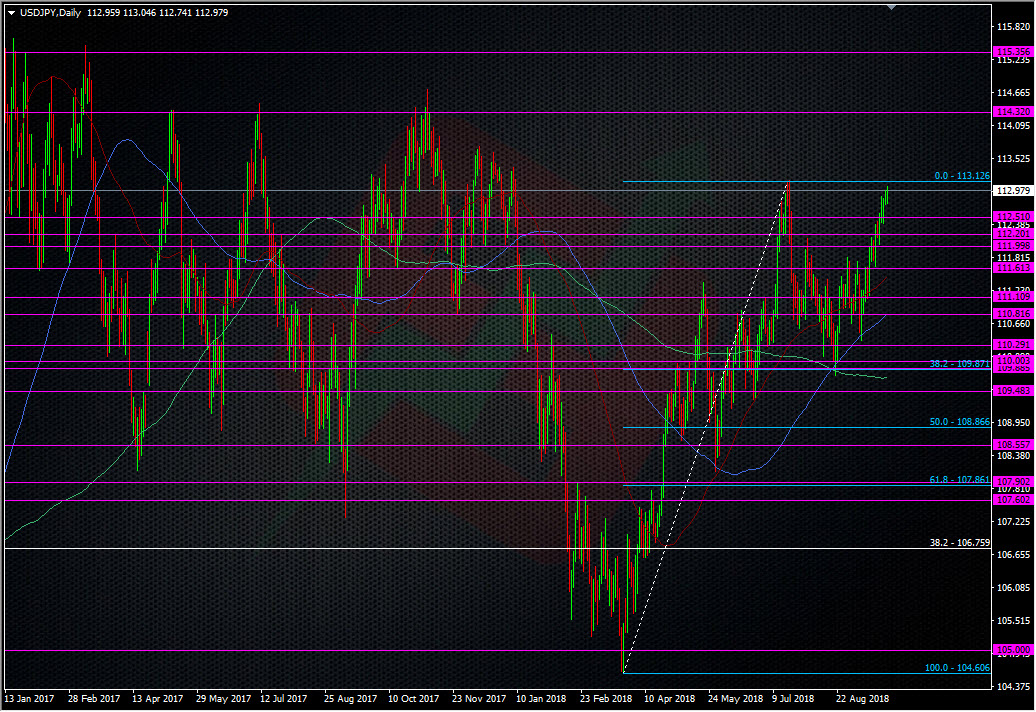
USDJPY daily chart
EURUSD
Up
- 1.1927/37 is the 50 fib of the 1.2577 drop and priror S&R. The 200 DMA sits just above at 1.1945
- 1.1903 is the 55 WMA sitting with the big fig
- 1.1880 will likely hold resistance ahead of 1.1900
- 1.1850 Part of the S&R package from 1.1800 and around the 14 June high. Clear there and we’re on for 1.1900
- 1.1820/30 was a sticky area on the way donw from the 1.20’s. It was the same on the way up through 2017.
- 1.1775-95 & 1.1800-15 – The recent highs.
Down
- 1.1725/30 has shown its hand again today
- Under 1.1700, 1.1650 is the stand out level and has been S&R. The 100 DMA is at 1.1659, the 55 MMA at 1.1658
- 1.1618/20 is the 38 fib of the Aug move and another milder S&R level. Aldo the 55 DMA
- 1.1600/10 -1.1590 has caught and held moves both ways. The 200 H4MA sits pretty much in the middle at 1.1596
- 1.1565/70 could provide the next support as a bit part S&R level
- 1.1557 is the 50 fib of the Aug move
- 1.1530 is the strong looking triple bottom, give or take a some change
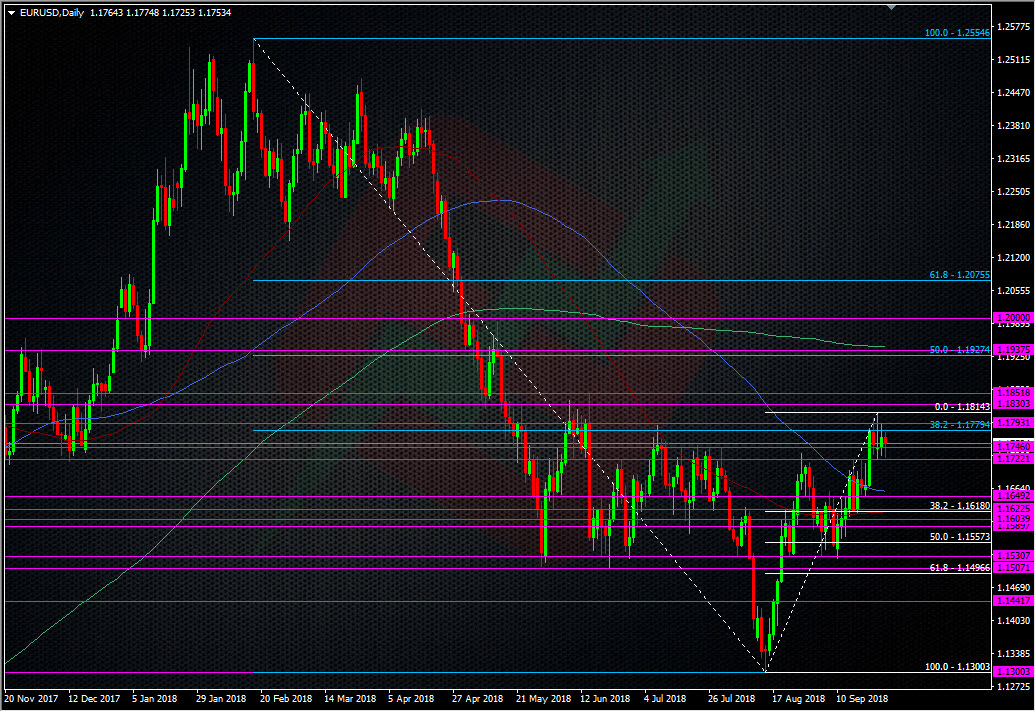
EURUSD daily chart
How should you use all these levels?
These levels are what I see on the charts as points of interest. There’s no rocket science behind it, we can all see the same levels but what I try to do is choose the ones I think will be the most strongest. For me, unless we’re very lucky, we’ll hardly get a chance to grab a move right on the announcement. We’ve got too much to read and the robots can read it quicker than we can, so the levels are here to see where a move may falter, stop or reverse after the price has gone. That doesn’t mean I’m looking to enter in against every level but it presents points where I may look to exit any held positions or to try and pick a possible stretch point for a reverse.
The first thing to understand is with the levels closest to the price at the time of the event. You can pretty much ignore the tech within 50 pips either way, more if we get big news. The further we go in a price move, the more likely the next levels in the way are likely to hold up any big move. But, don’t then ignore the tech that was close to the price which then moved through it. These levels can come into play if we return back to them after.
It’s still all a judgement call I can only make once I’ve read/seen/heard all the details of the event involved. For something like the NFP, I can usually assess things pretty quickly but for something like the FOMC tonight, we have a statement, forecasts and a presser to deal with, and even within that we have serveral moving parts to the rate picture itself, so it can take longer to read what the market thinks and then to decide if any moves are just kneejerk or the start of a larger move. If I do enter any trades, either to go with or against the moves, I’ll use the normal discipline of keeping trades tight and manageable, and if there’s no trade I like, so be it, I won’t trade for the sake of it.
A final thought before I hop for some grub before the FOMC is that I can see that some of the market, (and us here at ForexFlow) might be making this into something more that it should be. From our side, it’s about the risks of the Fed doing something unexpected but for others it’s about the Fed doing more than what’s expected. Pretty much every FOMC this year has been a dud for big price moves, mainly because the market is onboard with the Fed’s normalisation. There’s been no 200-300 pips moves on hikes, the market has been happy with what’s going on so has had no need to bust a move. The very same could happen tonight. We could get some jumpiness and then we move back on to other things (like trade). Don’t get too caught up in the hype and think that any move that happens is going to be worth hundreds of pips and that you need to grab a piece of it. Let the news and then the price action do the talking.
Good luck and trade safe.
Philosophy: “Don’t be a Dick for a tick”
Read how Ryan got into trading here
- The last NFP competition of 2022 - December 1, 2022
- Will this month’s US NFP be a horror show? - October 4, 2022
- US NFP competition – Do you think there’s going to be a turn in the US jobs market? - August 31, 2022
i noticed no levels for GU. are you not playing GU at all and why?
Hi Grassy.
Ran out of time if I’m honest 😀
no prob. thought you might not want to trade GU because perhaps it is too risky a pair or something.
real time volume from Fastmatch–might want to insert a widget on your site to show this perhaps.
https://tape.fastmatch.com/
and listings with avg daily volume: https://fastmatch.com/listings
So, what are this mob, a broker, liquidity provider?
an institutional ECN that started as a joint venture between CS and FXCM, then bought by Euronext. they have interesting new order types on their platform too, as well as how they handle last-look. FIX feed is only $250/month.
Hmm. I’ll have a better look. If it offers a view of orders then that might be something.