
Is this buyers choice for a USDJPY dip?
I’ve got two views for you. Here’s the intraday picture for all you FOMO dip buyers.
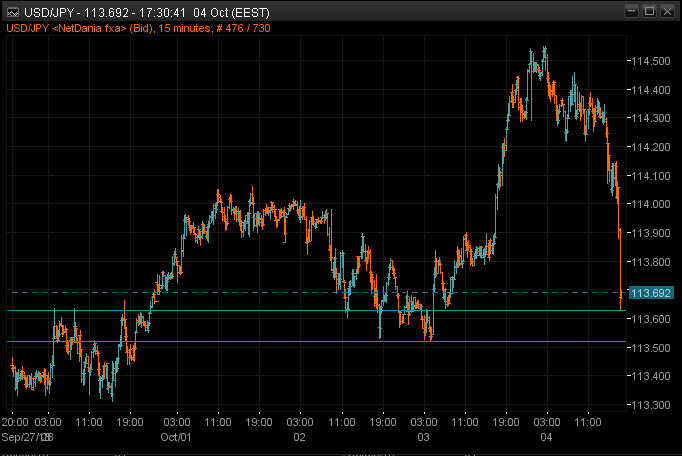
USDJPY 15m chart
There’s the dip area if you think we’re going back up.
But, if you do that, remember to keep the wider picture in focus.
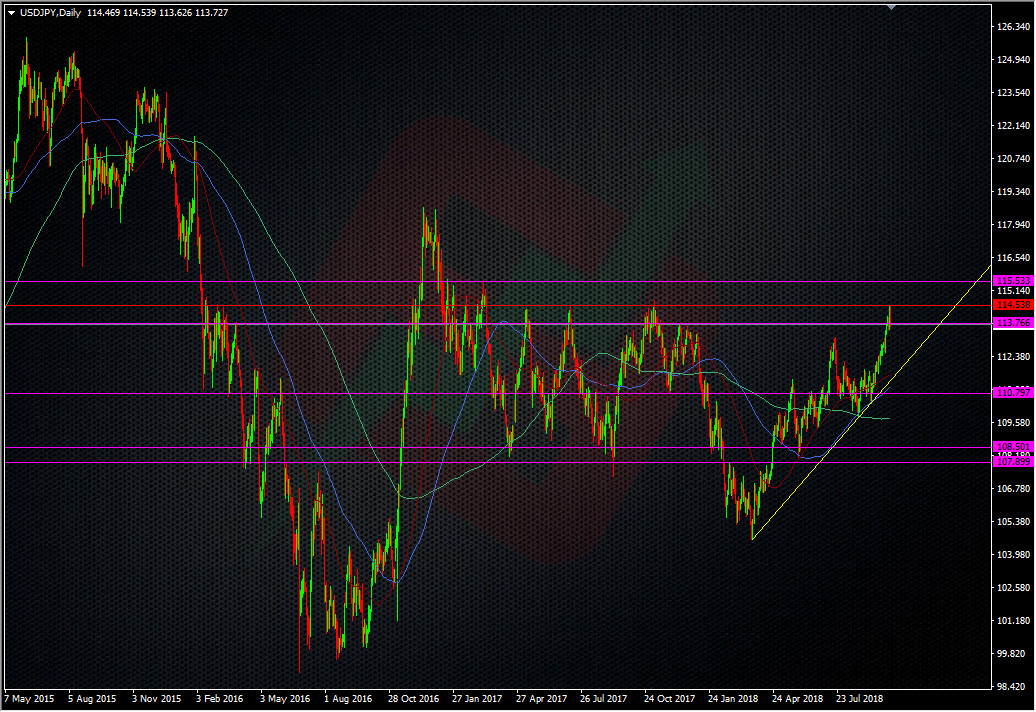
USDJPY daily chart
That clearly shows yet another failure at the wider range highs.
As usual, other market commentators and economists are late to the party in calling for this pair to run higher, and that often means a top gets slammed into place, temporarily or otherwise. If you tend to follow real traders, then you’ll know our very own K-man has been touting and riding this move from way down below 112.00.
Ignore the hype and trade properly. That means being guided by the charts not price chasing analysis. If you want to buy the dip, here’s a possible entry spot, which can be kept tight with a stop just below 30 in case you’re wrong. If we’re going to go higher then we need to clear 114.50 and then 115.00 to really cement a break. Anything less is just another failure. It really is that simple.
Like my colleagues, I’m going to put my money where my mouth is by trying to buy it as close to 113.50 as I can get it, with that very same stop just under 113.30. Nice and tight, low risk if I’m wrong, just like the AUDUSD trade yesterday.
Philosophy: “Don’t be a Dick for a tick”
Read how Ryan got into trading here
- The last NFP competition of 2022 - December 1, 2022
- Will this month’s US NFP be a horror show? - October 4, 2022
- US NFP competition – Do you think there’s going to be a turn in the US jobs market? - August 31, 2022
How it goes, it could be stop loss hunting tonight.
Yep. The problem is that you get a late rush to jump into the long side and then when it fails, you get a cascade from all those latecomers that are out the money on a 20 pip move south, who the panic that they’ve bought the top, and down it goes.
Where it stops is what we all try to work out 😉
For the longer term longs, who have a bit more stomach/patience than myself at times and have been building from where I started in the 111.40/60 zone, they’ll be watching that 113.30/50 area imo.
I had a small left over as per previous updates, which got unfortunately stopped out back through 113.80s on a trailing. Been a victim of the equity market impact on the JPY crosses and a few to many people who bought the highs by the looks of it. I’ll try again the long side at some point as many valid reasons for a long USDJPY remain.
But in the meantime I sold EURUSD at 1.1535 and NZDUSD at 0.6500 instead.
I also bought some AUDNZD here arnd 1.0910 and sold some EURGBP through 0.8850 for a testing scalp of the break of the 0.8850/55 support.