
It’s double bubble on the jobs front today so here’s some forex levels to pin on your wall
With little else happening in FX markets, getting prepped for the jobs data is the sensible thing to do.
With the market seemingly at higher level of positivity over the US economy, we might actually see the dollar and yields rising again if the data is good. Previously, good data has largely been ignored because all that mattered was if it was bad, and thus might have affected the Fed’s hike path. If we are seeing the start of another round of MAGA trading, good data should see USD lifted across the board. Will it be enough to punch through the wider ranges? I doubt it but we’re not here to guess, we’ll judge it by the price moves. So, here’s some levels to keep in mind.
USDJPY
UP
- 114.00/10 is the close intraday resistance but too close to the price
- 114.20/25 is more near-term resistance. That may contain on the money numbers
- 114.50/80 & 115.00 are really the main levels I’m looking up at top. This area is the top of the wider 108/114-115 range and it’s big. 115.00 is probably too big for this data alone but it’s in range for a stretch point on good numbers. I favour shorts into 115.00 but If we do smash through it then a break long is the likely trade but I will wait for confirmation. There;s also the time issue of seeing a big move on a Friday
Down
- 113.50/60 is the short-term support
- 113.20 is next, though it’s a bit mixed between 20/30. The 200 WMA is at 113.17 and that could be important on a closing basis today.
- 113.00 will be natural support
- 112.50 is our old friend and the start of some stronger support traffic. Regular readers will know that I’m always citing this level if and when we swim near it.
The chart speaks for itself and the dip buyers will be waiting. The battle is on between them and the sellers up top.

USDJPY daily chart
EURUSD
Up
- 1.1530/40 has been the level in the mix on both sides recently. Too close to the price right now
- 1.1590/1.1600 Was the top on Wednesday and where the standout resistance starts coming in. The 55 DMA is at 1.1605
- 1.1620/30 is the next band. We see the 55 MMA at 1.1615 and the 100 DMA at 1.1638. The 55&200 H4 ma’s are in the mix too at 1.1626 & 35.
- 1.1650 was a good S&R area through Aug & Sep
- 1.1700/20 would be a big ask but the level stands out
Down
- Yesterday’s low at 1.1460 is a consideration but quite close
- 1.1430/40 is next as it played a part in trying to keep the run to 1.13 in place
- 1.1400 is obvious and that stretches down to 1.1390 (there’s stops sitting there too). Should we see 1.1400break, that will leave the bigger picture looking very bleak and it will be more of a psychological scenario than a data driven one. That would bring the 1.1300 low right into play
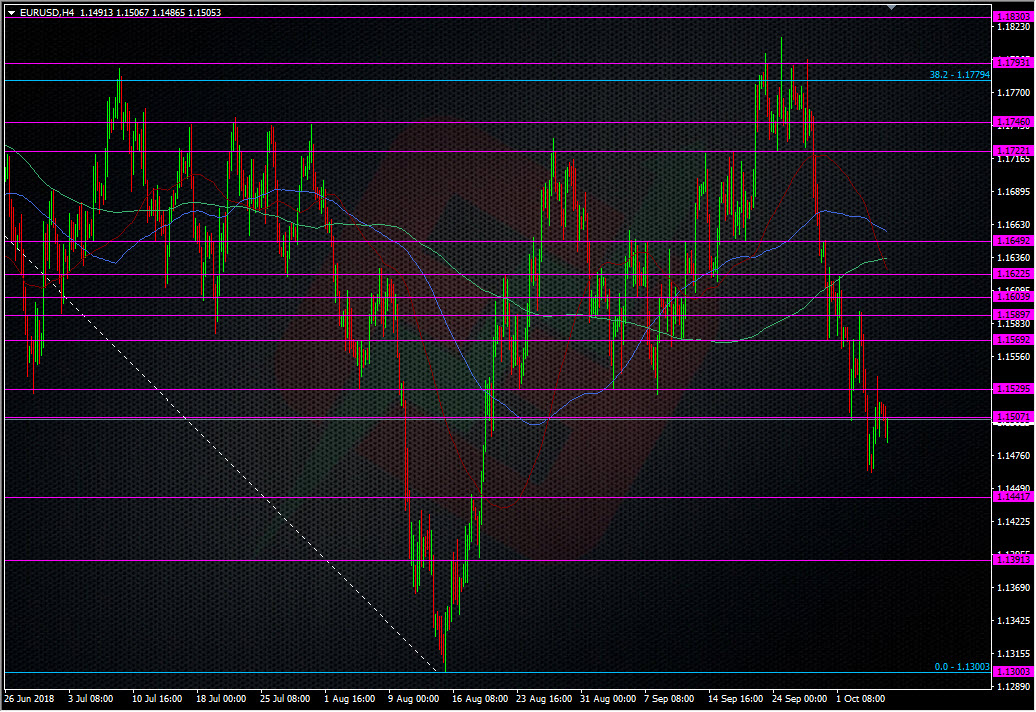
EURUSD H4 chart
USDCAD
This one has my trading attention probably more than other pairs today. I’m hankering for a short into the BOC’s expected hike because I think the market isn’t trading that yet, particularly after the 1.2880 break. The jobs data will also not be make or break for the BOC, so I’m looking to short into any big CAD weakness. Given how volatile CAD data can be, this might bring such an opportunity. Ideally I’m looking for 1.31/1.32 as my places of choice to build shorts but we’ll see what the data brings. For the levels today;
Up
- 1.2953 is the 200 WMA, we’re also tapping the 100 H4 ma at 1.2942. They’re not important now but could be if we move away and then return
- The channel top at 1.2963 is a bit close but we could see resistance around 1.2970/75 on mild numbers. The 100 WMA sits at 1.2971.
- 1.3000 has the 200 H4 ma
- 1.3027 holds the 55 DMA
- 1.3050 is an old S&R level. The 100 DMA is at 1.3058
- 1.3080/90 will show protection of 1.3100
- 1.3130 is prior S&R
- 1.3175/85 will be front running 1.3200, with 1.3220 a big line after that
Down
- 1.2880/85 is decent level still but might be a bit too close for big numbers
- 100 DMA 1.2875
- 1.2850/60 is minor, followed by 1.2840/45 which held the bounce from the lows for a while
- It’s all a bit messy under there so 1.2800 brings big figure emphasis into it
- 1.2780 was the NAFTA low
- Then we have 1.2730/40 and the bottom of the channel
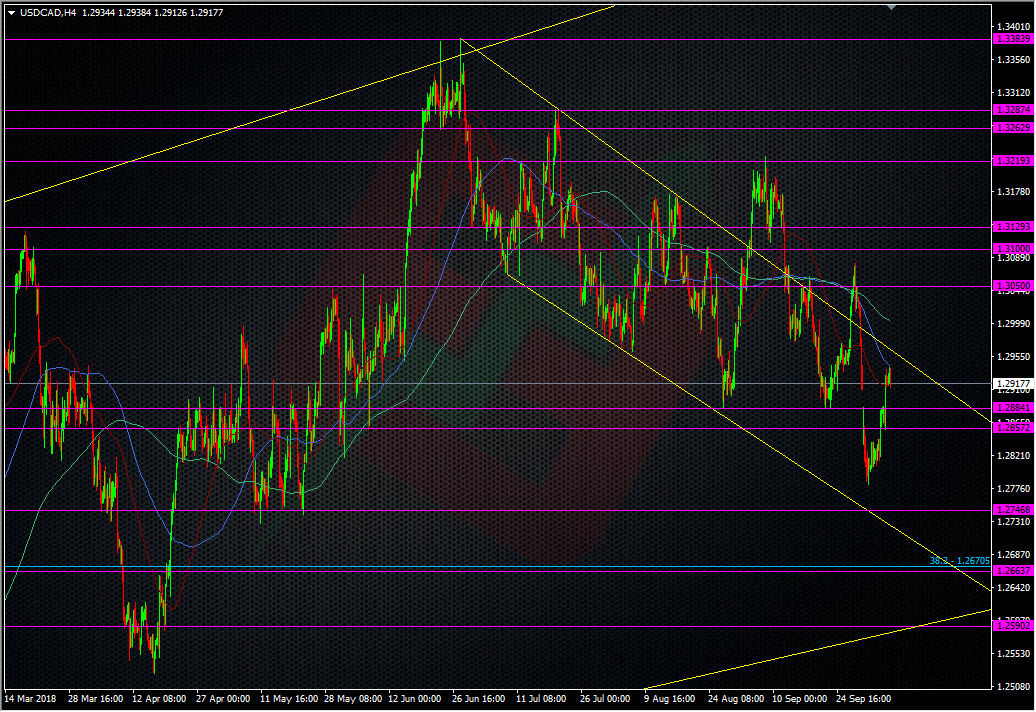
USDCAD H4 chart
GBPUSD
I’m not really looking to take anything in this pair with all the Brexit headlines going on but on a wide view basis, I’ll be watching 1.2920 down to 1.2880 for a long and anything near 1.3200 for a short, although I’d be loathed to get into something I’d have to sit in this close to the weekend. Overall I’m more of a buyer than a seller for the longer-term because at the back of my mind, I still favour seeing a Brexit deal get done.
For all the levels above, I look at these as potential pause or halt points in any moves we might see. I’m not looking to trade all those levels but if my assessment of the data has me thinking about a trade, these are the areas I’d look to lean against and define my risk.
Good luck today and don’t forget to enter our NFP competition.
Philosophy: “Don’t be a Dick for a tick”
Read how Ryan got into trading here
- The last NFP competition of 2022 - December 1, 2022
- Will this month’s US NFP be a horror show? - October 4, 2022
- US NFP competition – Do you think there’s going to be a turn in the US jobs market? - August 31, 2022