
USDJPY into the 114/115 area now and it shouldn’t be underestimated how big an area it is
IT’S MASSIVE!! Obviously there’s levels within it, starting around the current highs and through to 45/50, then 60/70. Then you can look at prior high points etc etc. A break through 115 would be the first big signs of breaking this area but for me, the blue zone 115.45/115.80’s is the real lift off zone that needs to be cleared to properly view it as a break of the 114/115 zone. Holding anywhere below that blue zone keeps it in play as a resistance area. 114 could become very key here for both the intraday picture and for this area in a long-term context. We may mess around in this area for a while. If we push higher (say close to or above 115) but come back to test 114 and it holds, the bullish momentum stays in place. If 114 fails, then we could be seeing a failure of the whole area. Time will tell.
Trying to trade big zones can be difficult. You can pick and chose the levels within it but usually I’ll look at the wider picture and just look to either go with a break of the upside or a breakdown on the downside. There will be a lot of noise in this zone so I’ll just treat the weekly chart like I would a lower timeframe chart. So, my key levels for potentially trading the next direction are 114 & 115.80/116.
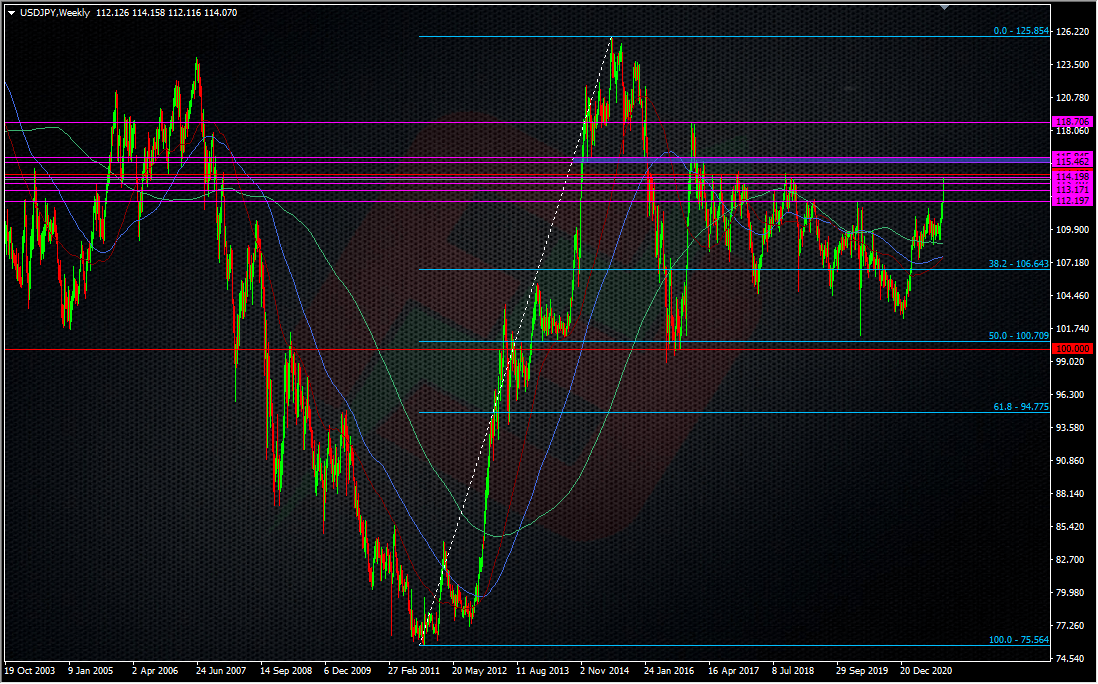
USDJPY Weekly
We’re well into that part of the show where the techs and all the rest (options, barriers etc etc) don’t really count for toffee. When we get moves like this you have to put less reliance on the tech levels. You have to know what sort of wind you’re pissing into if you want to trade against it. If you want to lean on your tech for trying to short yen pairs, go right ahead but know the risks right now.
When we get moments like this I’ll massively scale down my risk on trades going against the trend and keep stops very tight. More likely I’ll sit on my hands and let the price action tell me what’s what. Yesterday it looked like USDJPY was struggling while the crosses still went higher, so potentially showing signs of a top. That lasted until the afternoon when we started making new highs and then I wake up and it’s through 114.00. That’s not the time for me to be trying to fight it. What we want to see is a high put in that then gets confirmed after some good time has passed (a day, two days, something like that). A high showing for a few hours doesn’t tick the box right now.
On the flip side. Short-term longs picking the breaks now also need to keep trades pretty tight because we are going up with no decent pullbacks. The longer that goes on, the bigger the snap back will be when it happens, and it will happen. Moves like this need healthy pullbacks and 20-30 pips isn’t that. That might have been fine when we were moving through 110/111/112 but now we’re really rocking, a healthy ‘modest’ pullback might be 70-100 pips.
I’ve been long since September 2020 and was pulling my hair out a bit these last few months as we sat in that 109-111 zone forever. The break of 113 saw me take some profits of my 103 longs and I’m looking to cut more off if we see a move to 115. I’ll also be looking to try and add to a break above 116.
We’re in the midst of some big flows here so it’s often wise to pick your wider key levels and trade those rather than the noise in between.
Don;t forget that you can access much more analysis from the fantastic team at Forex Analytix by joining our platform here.
Philosophy: “Don’t be a Dick for a tick”
Read how Ryan got into trading here
- The last NFP competition of 2022 - December 1, 2022
- Will this month’s US NFP be a horror show? - October 4, 2022
- US NFP competition – Do you think there’s going to be a turn in the US jobs market? - August 31, 2022