
Time to look at the Non-farm payrolls data and what trading opportunities it may present
NFP day is here again. Don’t forget to enter our compo to win a Livesquawk subscription.
So, to the numbers we go;
- Dec 2017 NFP 148k
- BBG exp 180k (hi/lo 245k/140k . RTRS exp 180k (Hi/lo 230k/98k)
- Average earnings 0.3% exp m/m vs 0.3% prior
- 2.6% exp y/y vs 2.5% prior
- Average weekly hours 34.5 exp vs 34.5 prior
- Labour force participation rate 62.7% prior
- Unemployment rate 4.1% exp vs 4.1% prior
- ADP came in at 234k vs 185k exp
What do the experts say?
Goldman Sachs are in the number one spot for calling the NFP’s (no booing at the back!). Here’s the top five’s expectations
- Goldies 205k
- Moody’s 205k
- CTI Capital 212k
- BNPP 230k
- National Bank of Canada 160k
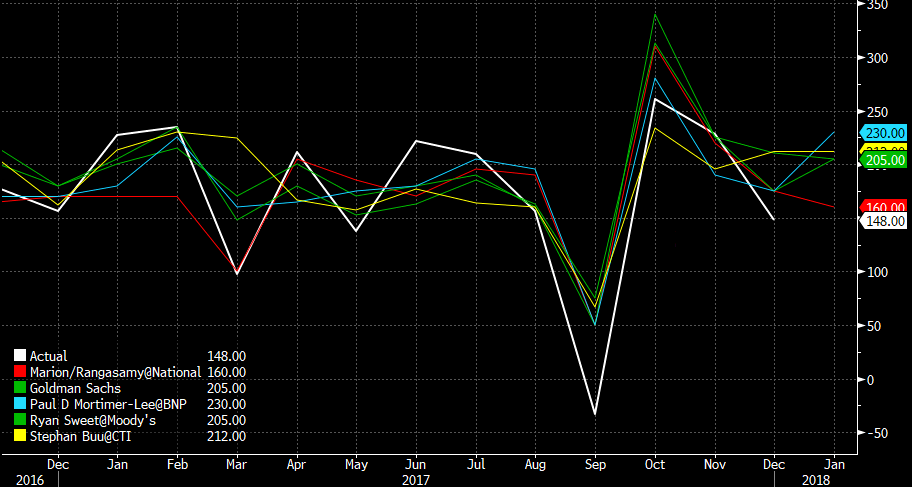
NFP pickers
What’s the trade?
The reations to the recent NFP’s have been less than inspiring, except for the 33k blow out last year but even that was soon reversed.
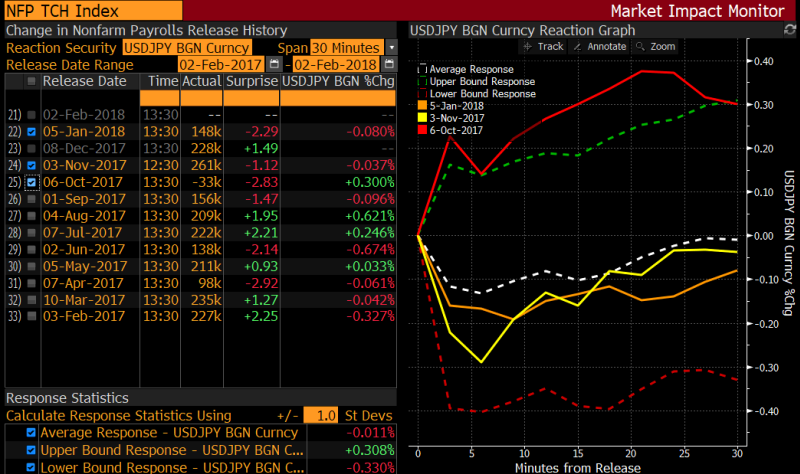
USDJPY NFP reaction

EURUSD NFP reaction
That doesn’t bode too well for trading as it indicates the low volatility around this data if there’s no shocks.
What we are seeing today is a further grind higher in the dollar across FX land, and that’s also coming with a rise in US bond yields. Not a pattern we’ve seen for a while. That might not be a monumental shift back to the old correlation but it’s worth monitoring. When the buck and yields move in tandem, that’s more a sign of the economic fundamentals at play, rather than the asset flow flight we’ve been seeing of late. That might mean that good numbers today will help aid this trend and that could push USDJPY up through 110.00, and into a better place and mood than it was last week, and into this week.
Conversely, mildy negative numbers could give a potential fade opportunity. If this mildly bullish USD sentiment continues, buying an NFP dip is what I’ll be looking to do. There’s a couple of areas I’m interested in, looking at the 15m chart.
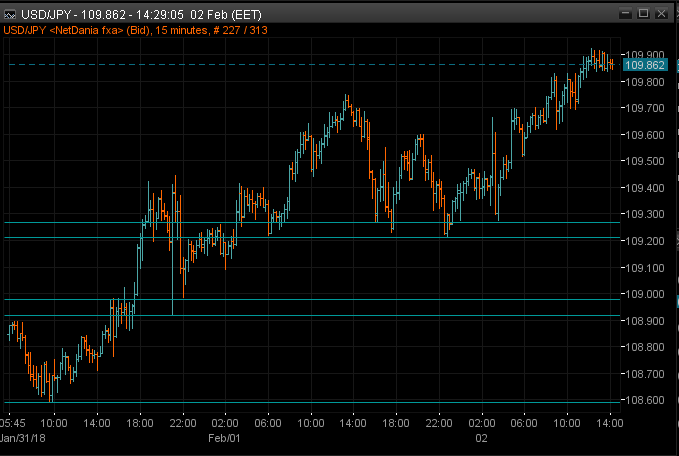
USDJPY 15m chart
Above, 110.00/20 is the main close resistance area on the market’s radar today. Should we test and fail there, we could see shorts stepping up to hit the rally, and that could lead to longs from below taking to the exits, leading to a steeper drop.

USDJPY daily chart
What could be the most important factor to end the week is that we’ve held the bottom of the 2017 range, even with yet another look below 108.50. That could be very significant moving forward, and confirm that we’re still not ready to break out from this long-held range. Where we end this week is going to be key. Above 110 will be a positive signal, below 110, we’re still treading water, below 109, the bearishness is still in play.
With a potentially wild data point like this, it pays to know both the short and longer-term levels close by. That way you can judge the numbers and apply them to your charts accordingly, and know which ones to trade. If the data is at or close to expectations, the intraday levels are the ones to trade. If there’s any shocks, look to the wider timeframes for your trading points.
All that’s left is to wish you good luck if you’re trading this and I wish you many pips.
Philosophy: “Don’t be a Dick for a tick”
Read how Ryan got into trading here
- The last NFP competition of 2022 - December 1, 2022
- Will this month’s US NFP be a horror show? - October 4, 2022
- US NFP competition – Do you think there’s going to be a turn in the US jobs market? - August 31, 2022