
This week we looked at a problem with the fibs in GBPUSD and we have another in NZDUSD
Earlier this week I looked at the technical picture in GBPUSD and the problem with different lows for a long-term fib. Today, we’ve got an issue with NZDUSD, which is important due to the RBNZ sending the pair lower.
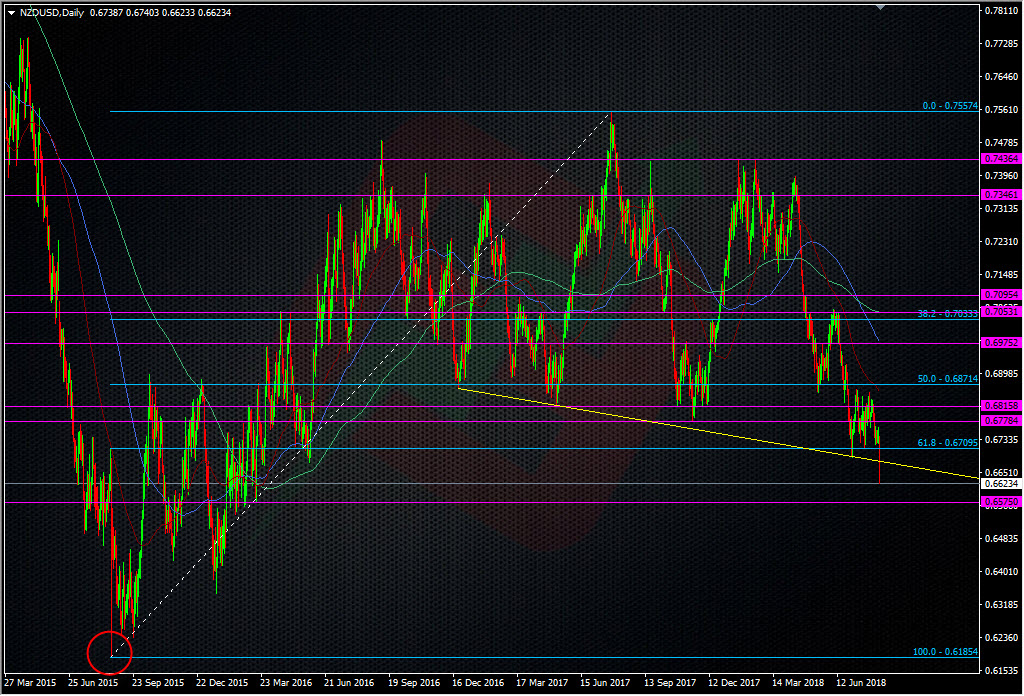
NZDUSD Daily chart
The problem is the flash crash low in 2015. Check your platforms because I have, and I’ve got multiple lows. Rtrs has 0.6000, I have others anywhere from 0.6070-0.6195. Depending on your low, the 61.8 fib above is either a bust or still in play. But, like GBPUSD, can we rely on it with so many different lows it’s been drawn from? If you take the Reuters low, the 31.8 fib is at 0.6595.
What do we do (again)?
Unlike cable, there’s no point in picking the next reliable low because the price would have broken it anyway as it’s higher. Overall, I’m not seeing anything juicy about the 2015 area with regards to picking possible support points, apart from the standout lows. The area around 0.6550/80 is something to look at but It’s not screaming “TRADE ME!”. If anything, I’m more inclined to hit a rally into the broken trend line and or the 0.6700 level.
Expected central bank moves (or lack of) still don’t move the market much but if the market is caught off guard by a change in sentiment, that’s what brings the bigger moves. Unless that sentiment suddenly changes again, we’ll see this pair keep a further bearish bias.
Philosophy: “Don’t be a Dick for a tick”
Read how Ryan got into trading here
- The last NFP competition of 2022 - December 1, 2022
- Will this month’s US NFP be a horror show? - October 4, 2022
- US NFP competition – Do you think there’s going to be a turn in the US jobs market? - August 31, 2022
Hi Ryan, there is another way of dissecting this using daily fibs. If you use the Fib extension tool to define the range from l from the daily high of 27th July 2017 at 7558.4 and the low of 17th November 2017 at 6780 and run the extension tool to the last daily high 16th February 2018 at 7437 then you can see the 100% extension was broken today at 6659. I would expect a break lower to at least the 123.6% extension area target being 6475. Just a thought as you know I would look for sentiment and data backup for this theory.
Sound analysis WD. I’ve never been one for fib extensions personally. I don’t really know why. Maybe I’m a bit of a dinosaur and just like the 3 main ones 😀
Hi Ryan, one of my previous studies was Elliot Wave. It had some good ideas but I still lost money ;>
Not only the fibs, CoT data are not very helpful too: Non-Commercial short position is at extreme not seen since 2009 (the oldest data I can retrieve), and actually started trimming a bit since start of Jul, but NZDUSD just kept falling down, teamed up with EM currencies.
We have to be careful with the COT data because it’s not the panacea many think it is. We’ve recently just come off of a huge JPY short position that had been offside for a very long time. The COT numbers are often not indicative of what the spot market actually does.