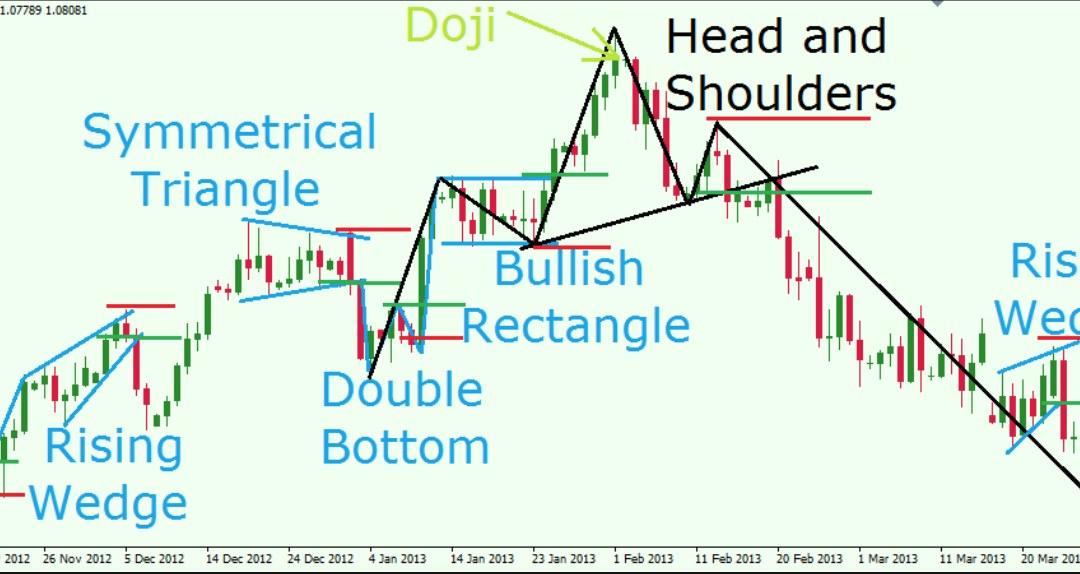
Last week a guy sent me his chart and daily market view. He just recently completed a PHD from Cambridge in Mathematics and I felt intrigued as to what his thinking was. His chart contained Stochastics, RSI’s, Bollinger Bands, Ichimoku Clouds, and my all time favourite – MACD. But there’s more. Along with this he had fibonacci retracements, S+R lines, trend channels, head and shoulders, cup and saucers, flags, pennants, triangles, even pitchforks. And last but not least he had something I used heavily as a futures trader: vwaps, and market delta standard deviation. The crafty old dog! Anyway, the list goes on. Ad infinitum.
The chart was awful and I told him in the nicest possible way. I asked him if i needed a phd from Cambridge to understand it. He never got back to me.
The point of this post is to highlight that you don’t need fancy shmancy charts to be a good trader. Understand these terms of course but when you read a market please try and keep it simple. FX is made complicated by some, and made simple by others. Decide where you sit. Let’s look at my chart and CABLE this morning. I ask my self the following questions when i read a chart: Is the price going up or mostly going down ? Is it trading above or below the two main moving averages ? Work it out and that’s your bias and context within the probabilty of strength or weakness of your chosen pair.
Let me spell it out for you on CABLE. The price below looks like it’s going down and is below 2 moving averages. That means my bias is bearish. I use this as confluence with my fundamental knowledge to create my daily edge. I ask myself many more questions but that’s another post.
Thanks for listening and watch that risk now.
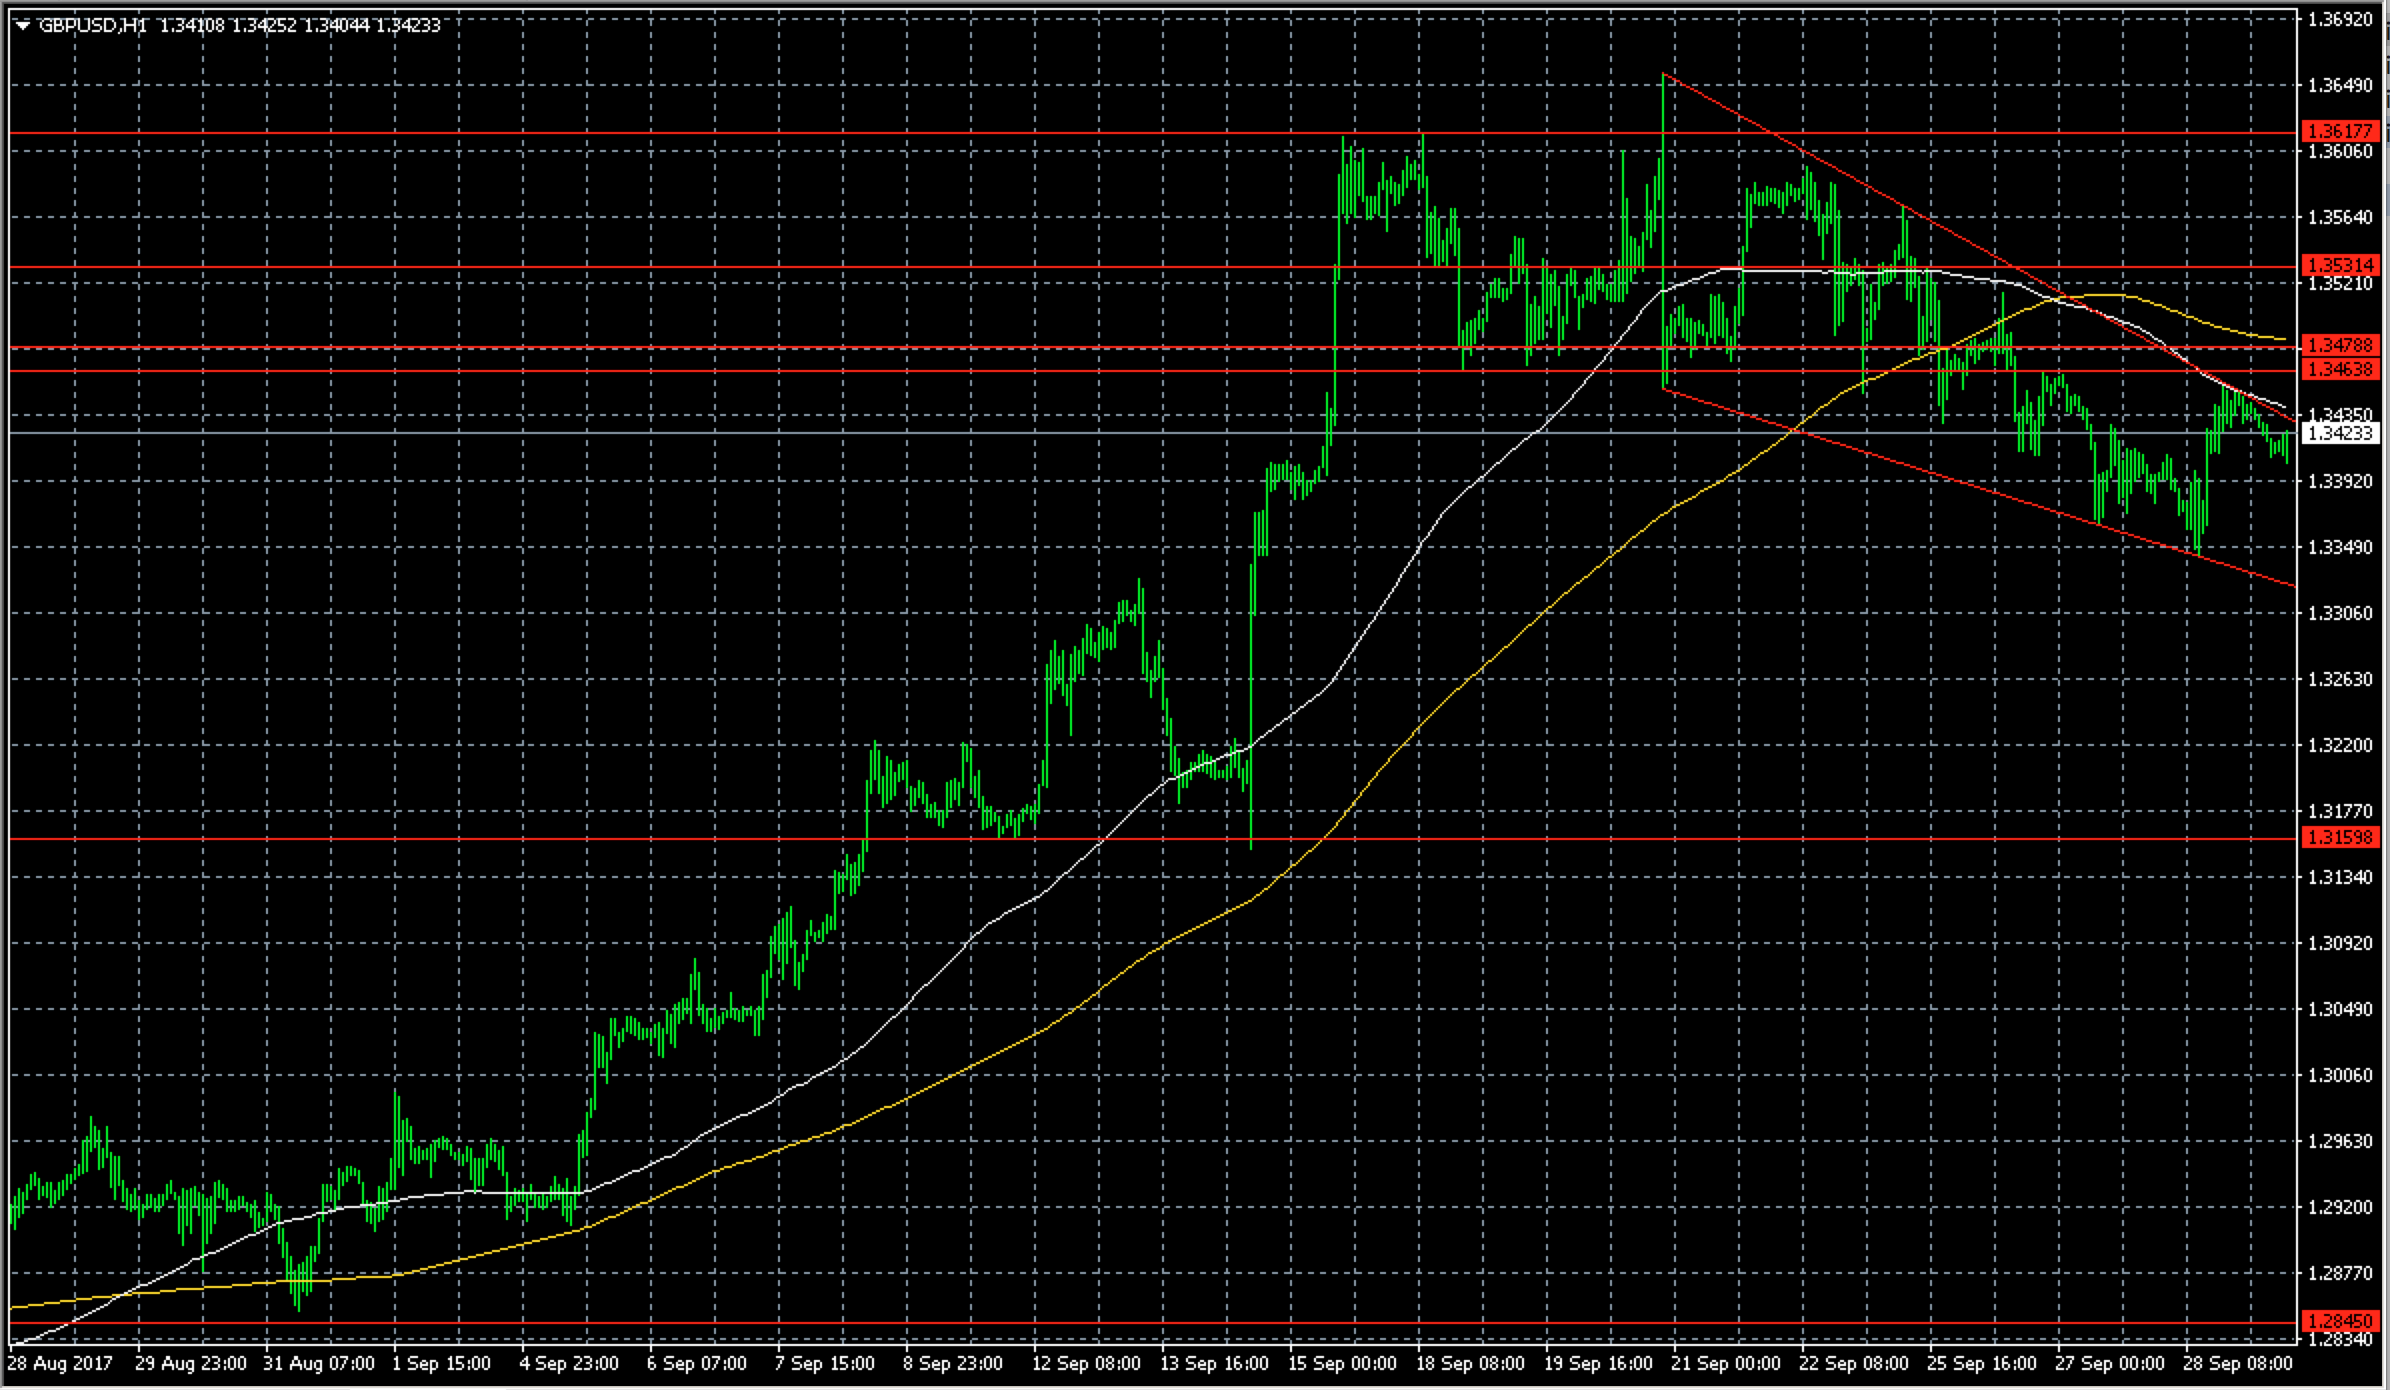
GBPUSD Hourly chart

Philosophy: "Define your risk, only then can you ignore it"
Read how Patrick got into trading here
- How to trade: A LEVEL - August 4, 2018
- USD mixed – a bit like me - June 5, 2018
- What is the market focused on ? Over to you trader. - May 29, 2018
I don’t know about that. Still looking bullish to me, don’t count it out just yet.
Oh… so its been 7 days since this post. What happened?! I haven’t been watching cable?
Hi Peter
Thanks for the comments and the post went out yesterday. With regards to PA we still sit below these MA’s so my view doesn’t change. The only slightly bullish element is that we closed in NA just off the lows. All i try and do is read whats in front of me and right now the price is below two main moving averages. Anyway, have a great weekend !
P
Great Philosophy!!!
Great post Patrick. Thanks