A look at broker spreads around big economic data points
As part of ForexFlow’s efforts to help bring as much clarity to traders as possible, I’ve teamed up with my good friends at Tradeproofer.com to bring you some of their broker analysis. These folks are an independent site dedicated to analysing the costs and spreads offered by retail brokers. For example, you can check exactly how much it would cost to trade with over 90 brokers. One of their best features is the ability to check trade prices if you have a dispute with your broker.
Among other things, what I’ve been inerested in is their broker spread analysis across the big data points. As an example, I asked if they could take a look at USDJPY over last Friday’s NFP. This is an area they are just getting into so it’s not fully interactive just yet, and it’s based on massive amounts of data over a very short period.
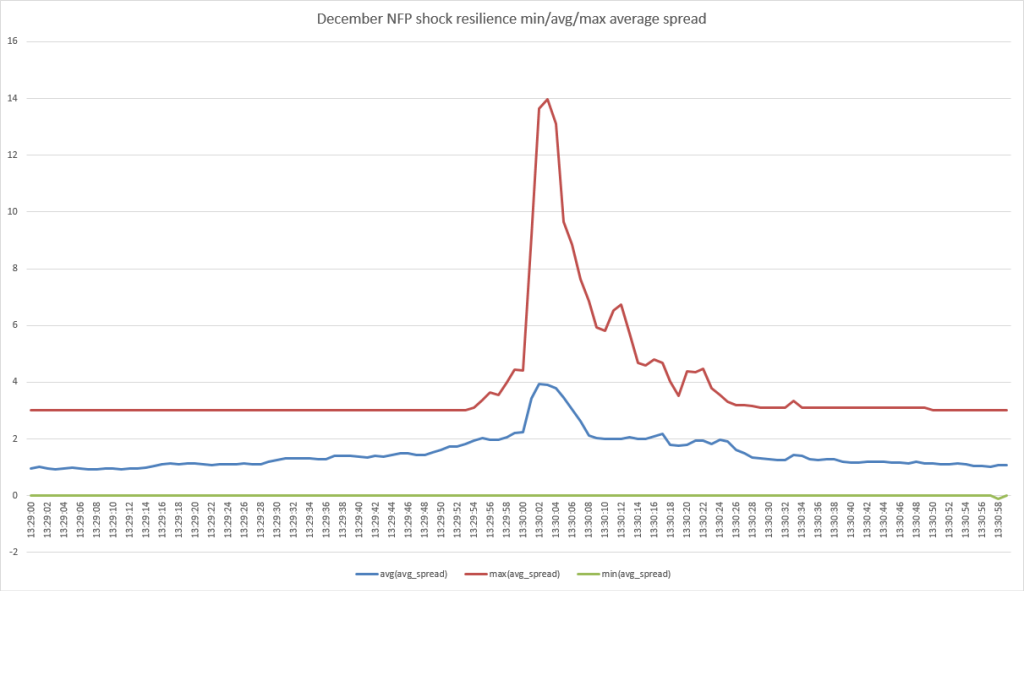
USDJPY spread analysis over NFP 8 December 2017
This is just a snapshot over a volatile few seconds (over 29 brokers) but it shows how much spreads can be affected. This is not unique to just retail markets as spreads can widen in the interbank too as liquidity can drop into events like this. That’s why we can often see jumpy moves in the seconds leading up to releases. What is good to see is that spreads return to normal levels very quickly.
As I mentioned, this is an ongoing project for the guys at Tradeproofer and I hope to bring you further analysis as they develop it. You can also sync your trading accounts to their system to help provide spread analysis.
Philosophy: “Don’t be a Dick for a tick”
Read how Ryan got into trading here
- The last NFP competition of 2022 - December 1, 2022
- Will this month’s US NFP be a horror show? - October 4, 2022
- US NFP competition – Do you think there’s going to be a turn in the US jobs market? - August 31, 2022
mate looks good site and many thanks for sharing! it opens best for me in Chrome over explorer btw. good to see IG #1 who I use a lot, it looks like a nice #gocomparethe meerkat’ or ‘moneysupermarket’ and that’s a smart thing they’re doing!! cheers
Cheers David.
they dont have activtrades….