
A reversal in markets from the Chinese rebuttal on bond buying leaves a lot to be desired
Bond markets are in a spot of bother. We were already seeing a sell off in bond markets, particularly Japan and the US and yesterday’s Chinese news was just more petrol on that fire. I was skeptical on the Bloomberg story yesterday, and that skepticism has been proved mostly right with comments from China saying that the stories that they would reduce or halt US Treasury buying is perhaps based on “erroneous information”.
Yesterday I retweeted probably the most level-headed explanation of the day;
I gather China is considering slowing or halting its Treasury purchases …
1) the most straightforward (& boring) explanation is that China has hit its Treasury portfolio target (~ 40%) and has no further need to buy if reserves are constant.
here are China's US holdings pic.twitter.com/wkqFmFwwgo
— Brad Setser (@Brad_Setser) January 10, 2018
That analysis was backed up by the Chinese comments saying that they had been diversifying their foreign exchange investments and that investments in UST’s are market driven. Still, by fair means or foul, I doubt China will mind the shot across the US’s bow whether it came by their hand or not.
Our concern is always the market reaction and what clues we can glean from the moves. The biggest factor that sticks out today is that we haven’t seen a complete reversal of the moves yesterday. As I mentioned further up, the bond market was already in a strop and yesterday’s news was just another straw on the camel’s back. GBPUSD and EURUSD have given back all that they made on the news yesterday, and a bit more in cable’s case but yen pairs have only seen a tepid bounce. JGB’s have reversed down to a low 0.064% after getting very close to the 0.1% threshold yesterday. The BOJ’s bond purchases today were unchanged from previously, so that calmed some nerves following their news that they would cut back on buying longer dated bonds. US 10-year yields have tracked down to 2.53% from 2.60% yesterday, not a full reversal.
So, what happens next?
The fact we haven’t really reversed all yesterday’s moves completely tells its own story. A full reversal would tell us that the news was a flash in the pan event and its business as usual. A modest reversal tells us that perhaps we’re not yet done with the moves we saw in the last three days. However, as is often the case, the answers can lead to more questions, i.e. what is really happening in bond markets?
The USD/UST yield correlation works well when bond moves are based on fundamentals. An improving economy often sees a switch out of safer assets like bonds and into riskier assets like stocks, thus bonds sell off and yields rise. The knock on is that the US becomes a great place to invest in and thus the dollar sees good buying. When bonds move because of signs of trouble, the USD/yield relationship can be flipped on its head, which is what we saw yesterday. The reasons why bond markets are a little edgy could be numerous. A lot of this could still be New Year asset flows where firms have decided to switch their portfolios around. We could be seeing some nerves from the stratospheriocal rise in stocks and a run into cash. This could be purely based on US fundamentals being viewed as being stronger on the back of the tax cuts. It could be positioning on further Fed hikes. As I say, there might be many reasons and until we hear of a definitive answer, it’s all guess work, and as we know as traders, guessing is not a strategy.
How do we trade it then?
We do what we always do and trade the levels that are real and not guess work. We lean with the market bias and trade with greater conviction when the market is going the same way, and we trade tighter when going against the bias. If we’re in control we can make money when we’re right and lose less when we’re wrong. I did both yesterday. I trusted the 112 level enough on Tuesday to leave a bid in at 112.05 overnight with a stop at 111.80. It lost but that stop level looked very good when it was trading at 111.30. I shorted the euro at 1.20 when it looked like the China news move was running out of legs and won. As traders we have to have trust in the levels or we’d never trade. How we assess those levels (with/against the market bias) determines how much risk we wish to place on our trades. It means we stand a chance of maximising returns and minimising losses, a ratio we should always be aiming for.
From here, we’ll have to see if what’s been broken gets fixed. USDJPY has failed in its bounce to get back above the 111.85/90 that became resistance from the 112 break. That’s a signal that buyers aren’t strong enough or confident enough to reverse all the losses. The 111.55/65 area also became resistance yesterday and today’s break is finding support there as I type.
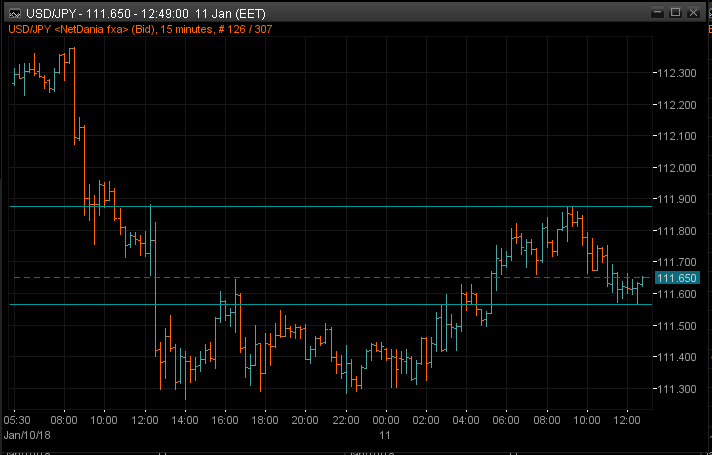
USDJPY 15m chart
For now, we have some indecision. Buyers can get a shot at 112.00 and sellers can’t get it lower. Whichever way it goes will decide the next direction, no guess work needed. I believe that USDJPY is still bearish so I’ll be watching 112.00 with a view to a short but I’ll also be happy to test the support around 111.00 with a tight long.
Analysing news and moves is all well and good but at the end of the day, the price action is our ultimate guide and we ignore it at our peril. When all is said and done, I don’t really care who’s doing what in the market, all I care about is whether I’m going to trade a level or not, and the amount I’m prepared to risk on it. That’s within my control, everything else isn’t.
Philosophy: “Don’t be a Dick for a tick”
Read how Ryan got into trading here
- The last NFP competition of 2022 - December 1, 2022
- Will this month’s US NFP be a horror show? - October 4, 2022
- US NFP competition – Do you think there’s going to be a turn in the US jobs market? - August 31, 2022
Thanks Ryan
Your last para is so true and is a timely reminder
Cheers John
Good stuff Ryan. Setser is right and with China`s FX reserves max`d around the 3trln mark, their own preferred maximum level, what else can they buy other than more US10`s yielding high? Yesterday was a “gun under the table” to Trump ahead of the State of Union address where Trump is expected to announce serious tariffs on China together with other warnings that Trump intends to make. China can`t dump treasuries. Send US yields higher (prices down) and wipe the values off the bulk of their Treasuries holdings? Not likely! They will turn to EM`s in the same way they turned there in 2009 and 2012. Trickle US T`s out and buy EM yields. I back China to win out on this one
If we see things hotting up between the US and China I think the bond issue could well become a stick used by China. It would come down to who would lose the most, China on it’s portfolio or the US as yields get all screwed up?
Great post Ryan. Now they can reset the timer on Gross, about 3 months for the next bond bear mkt rant 😉
Hahaha. I’m offered at 3 months, 1 month bid.