The chart has been in a bullish trend since last April when viewed on the daily. A major down day on Monday after price made new highs could be the first sign of trouble ahead.
The Hourly chart is showing price hovering between the 50% – 61.8% of the February range. This is what I will be watching for clues Intraday.
The fibs (gold shaded area) and the Ichimoku cloud going forward show the same range. This is my preferred way of using Ichimoku. I’m not too concerned with the Kijun-sen / Tenkan sen crosses (red and blue lines) as they are a lagging Indicator. I will set out a post on how I use Ichimoku Kinko Hyo at a later date, as I use it on charts of H1 and above on at least one of my chart set ups at all times.
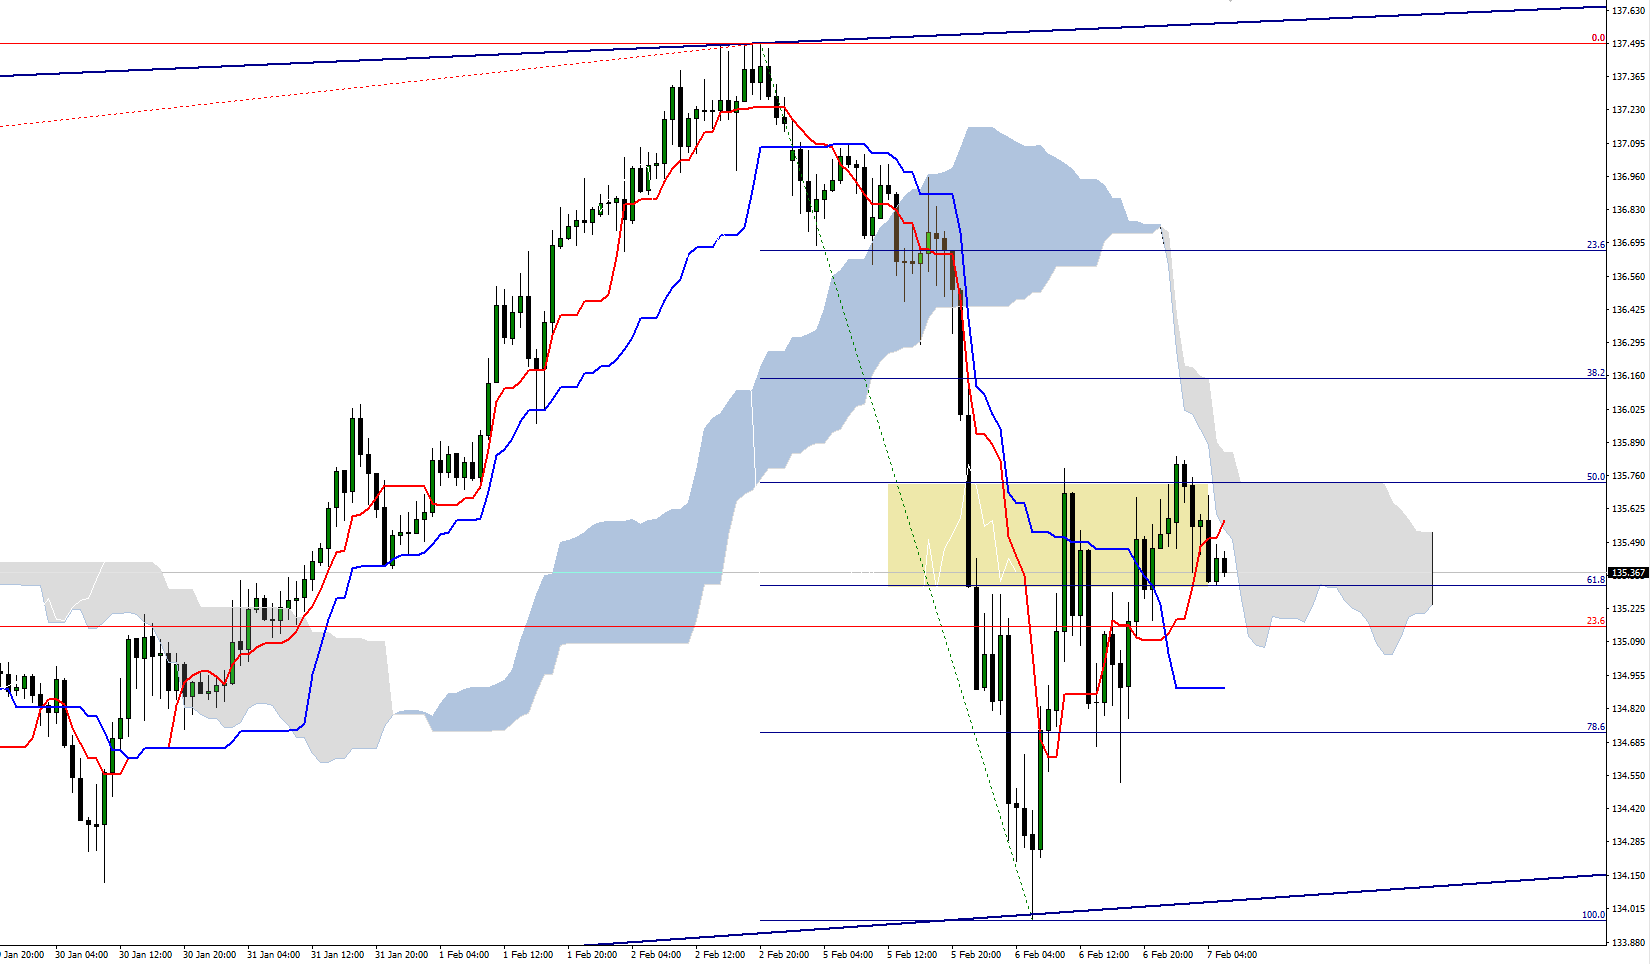
EURJPY Hourly
The H4 chart below shows the impressive run …………….. I am holding a short position from the Asia session today, but keeping nimble .
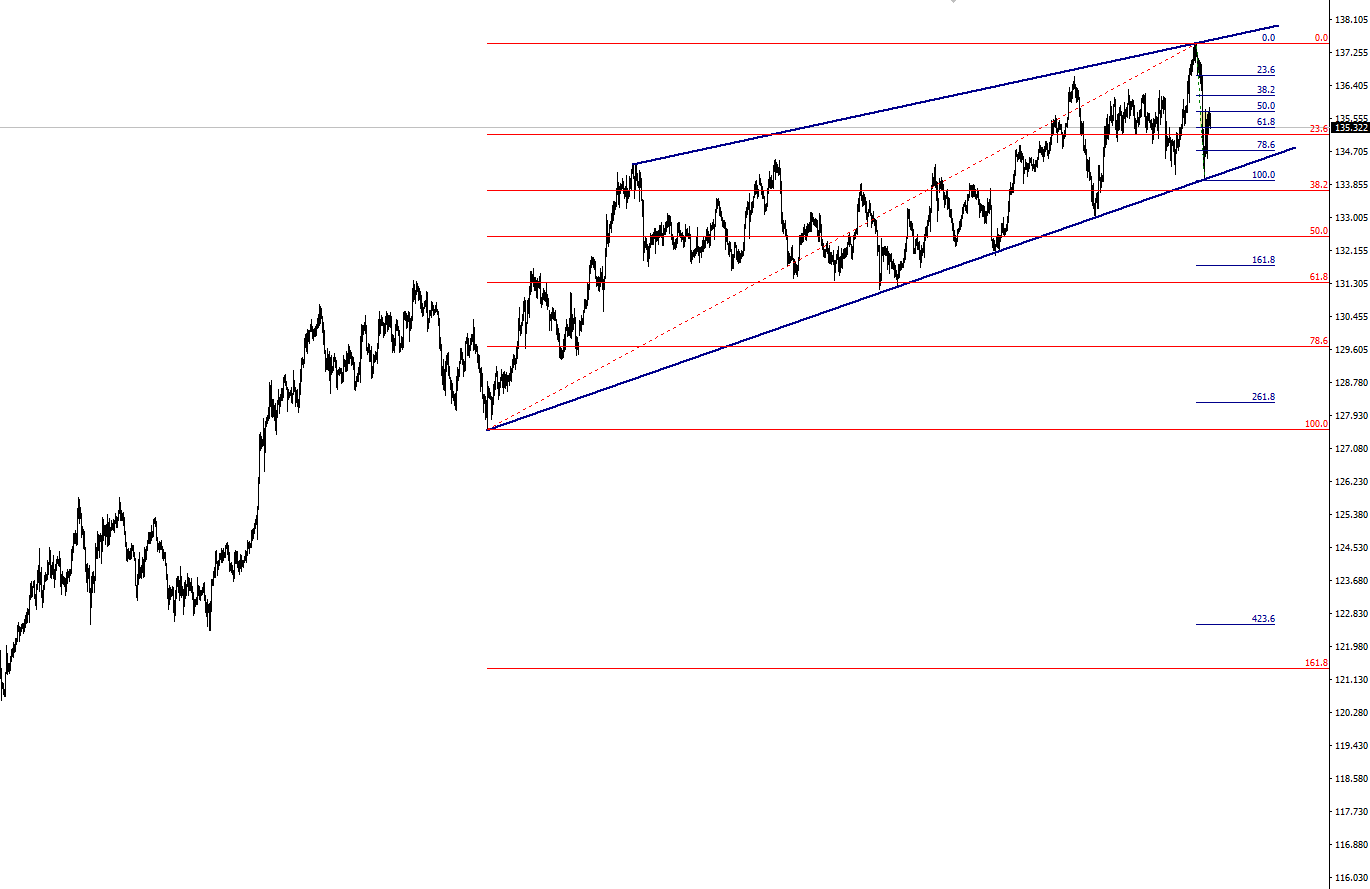
EURJPY H4

Collects more scalps than Crazy Horse and newly crowned Bitcoin & Dow top calling master.
Philosophy: "Trading rules.....it most certainly does"
Read how Horatio got into trading here
Philosophy: "Trading rules.....it most certainly does"
Read how Horatio got into trading here
Latest posts by Horatio Dubsly (see all)
- Silver – This weeks shining star, as predicted by ForexFlow - July 19, 2019
- 新年快乐 财源滚滚 大吉大利 A Happy wealthy healthy New Year to all our Chinese friends - February 4, 2019
- Gold and Silver – Glittering prizes? - January 28, 2019