I’ve been bullish both precious metals since the end of last year. The future looks bright from a chart perspective .
Much is written about the seasonal nature of gold. The Chinese and Indian festival buying sprees. As with all seasonal ‘trends’, this does not always prove to be a reliable trade indicator.
Gold is showing signs of life after a lackluster period during the first half of 2018. A game of two halves, with a steady recovery from the August lows. Finishing with a stronger, more determined move into year end.
The following H4 chart is showing a healthy trendline break on Friday. This could present a dip buying opportunity as the new week unfolds. Price has been stepping up and then falling back in periods on consolidation. Friday’s action could take the form of the move back in mid December. A similar break of trendline, followed by a retest and resulting push higher ( yellow arrows ). Worth keeping an eye on the current break for a pullback, and possible long entry down towards the broken trendline ,which could offer good support
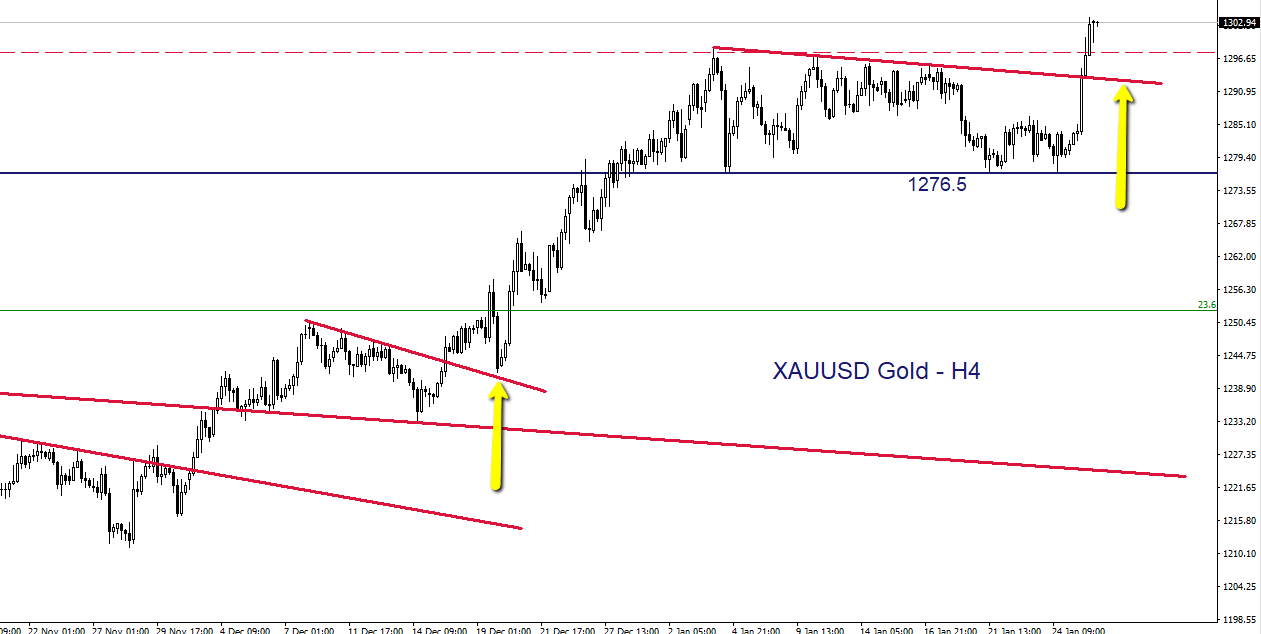
Gold H4 Chart
Silver has carved out a promising basing pattern on the Daily chart. I called for a long position in the ForexFlow trading room in late December, and placed an order to buy at $14.95. I took part profits at my first target of $15.70 for a near 6% profit. Price has fallen back for most of this month, followed by another strong daily move on Friday.

The resulting price action is in the process of carving out a hook pattern. These tend to be a bullish sign. A break of resistance towards the 15.90 area could see a continuing move, resulting in another leg higher .
Thinking in terms of a USD rollover and an increasing risk adverse environment — Gold and Silver have all the hallmarks of a lustrous future.
Please excuse my sporadic appearances of late, access from behind the Great wall has been patchy of late.


Philosophy: "Trading rules.....it most certainly does"
Read how Horatio got into trading here
- Silver – This weeks shining star, as predicted by ForexFlow - July 19, 2019
- 新年快乐 财源滚滚 大吉大利 A Happy wealthy healthy New Year to all our Chinese friends - February 4, 2019
- Gold and Silver – Glittering prizes? - January 28, 2019