
It can often be the kiss of death writing about EURUSD in the Asia session without the luxury of knowing which way the market will view things on the European / London open .
The only sure thing is that I wont be looking to buy. The charts across the timeframes are beginning to look ‘toppy’ to me – Enough to launch an opening salvo to the sell side at 1.2370. The 50% of the late March to April swing low ( blue area on the chart below ) will be used as a marker by myself to gauge any selling pressure today . A breach of the 1.2340 will have me adding to the position .
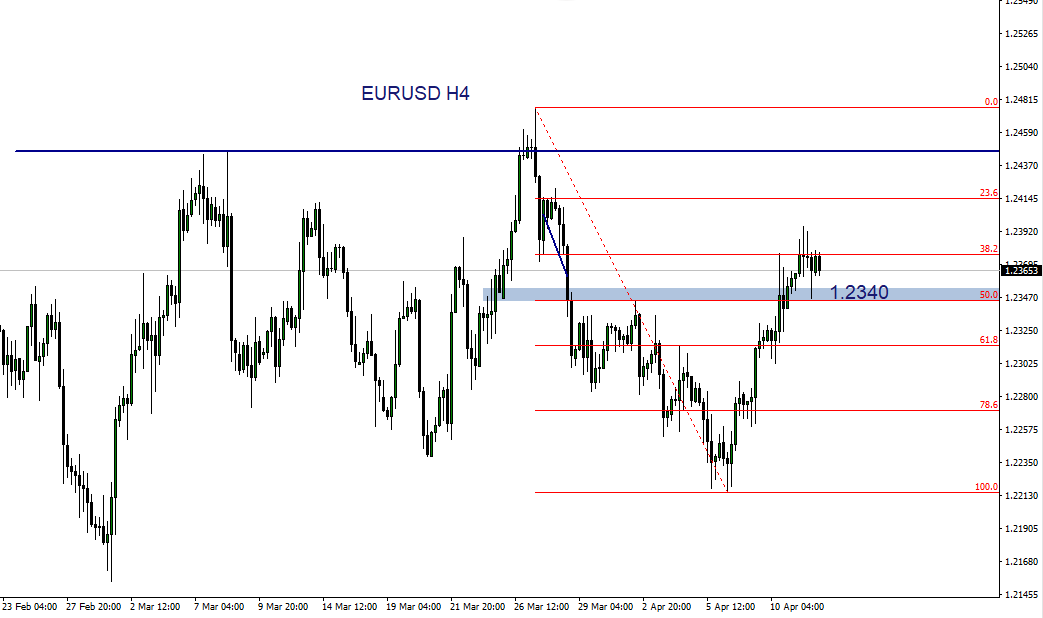
EURUSD-H4
The 30 minute charts that follow, show how I like to use the Ichimoku indicator for support / resistance. It is also a very useful tool for setting your stop loss on open trades. I tend not to use the Kijun sen / Tenkan sen averages although the Kijun sen can be very useful on the Daily’s as a guide to price strength and med / longer term directional bias ………………These are my personal preferences on Ichimoku and a little different to the ‘textbook’ way of interpretation . The cloud is the most important feature for me. Most useful and prophetic on the +30 minute timeframes.

EURUSD-30 minute
A zoomed out view of the 30 minute chart demonstrating how the clouds can be used as a focus for stop loss placement .
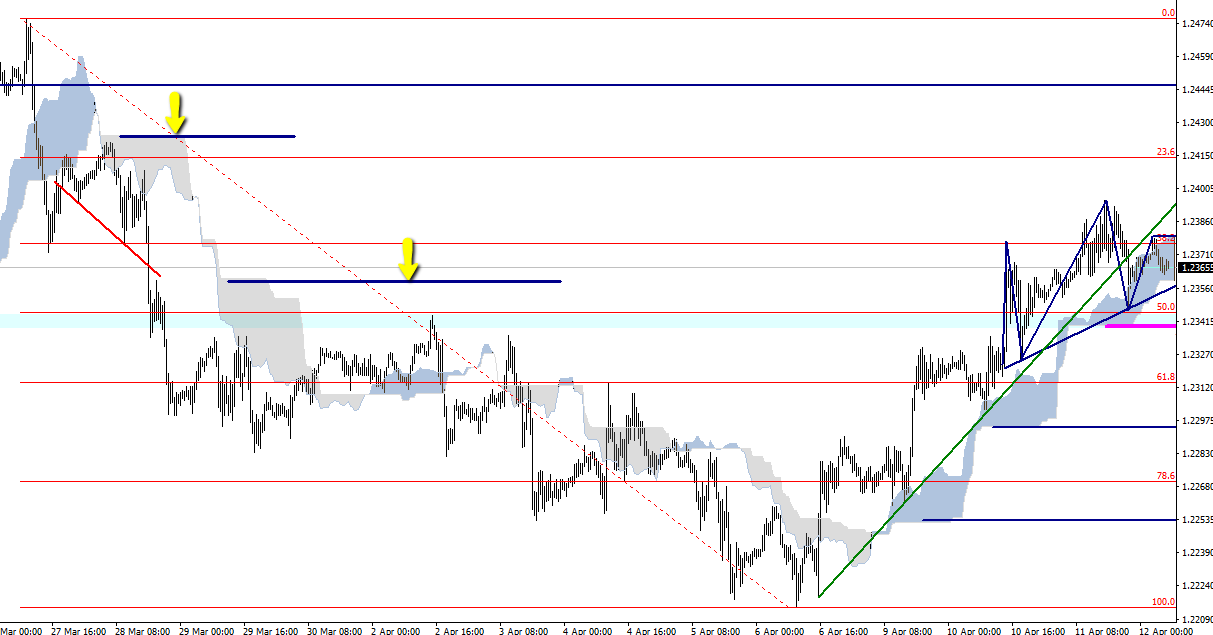
EURUSD 30 minute wide view

Philosophy: "Trading rules.....it most certainly does"
Read how Horatio got into trading here
- Silver – This weeks shining star, as predicted by ForexFlow - July 19, 2019
- 新年快乐 财源滚滚 大吉大利 A Happy wealthy healthy New Year to all our Chinese friends - February 4, 2019
- Gold and Silver – Glittering prizes? - January 28, 2019