Has the rot in NZDUSD stopped or not? An update on trading the kiwi
Last week our live trading room was in scalp heaven pinching pips from the lows in NZDUSD, so what’s the game plan this week? Have we got a true bottom in place or are we just taking a breather before the next leg down?
This love story continues this week as we find the pair looking a touch more balanced than of late. Last week I was looking towards an old S&R point around 0.7050/55 and the fib confluence around 0.7030. This was an area I was looking at to see if we’d get some respite from all the selling. The tech looked strong and after an very firm sell off, it could combine to see at least a temporary halt to the selling. And, so it has proved so far.
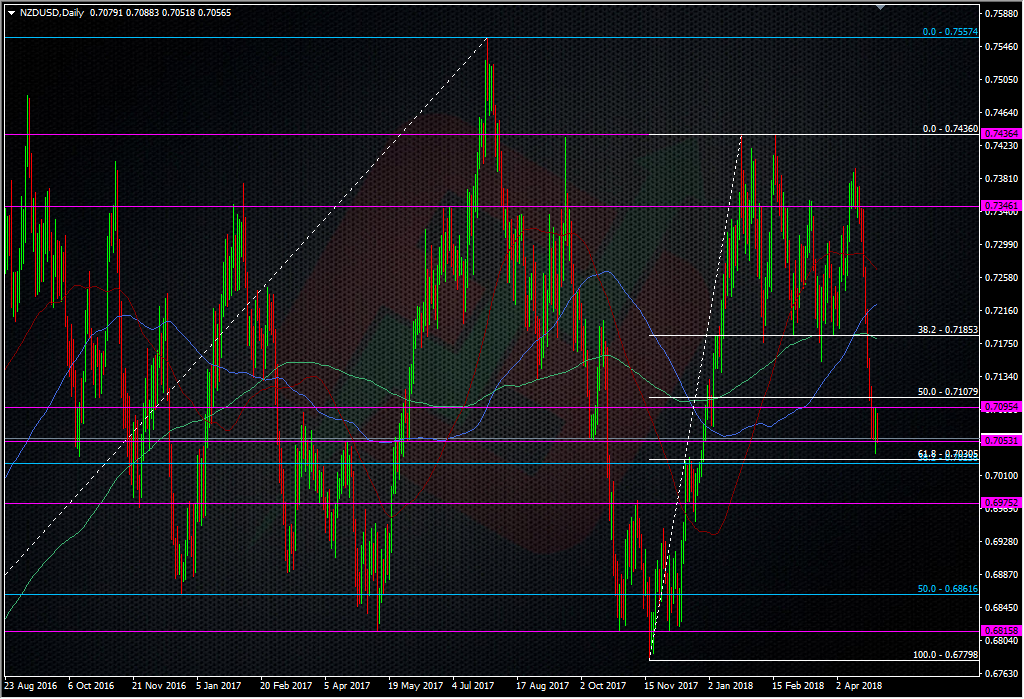
NZDUSD daily chart
At this very moment, we’ve tepid signs of a bottom in place and there’s been justification for trying to catch falling knives. As you may or may not know, my thought process behind trying to pick tops and bottoms is to find a reason (and a strong reason) why a price may stop its run. Other people in the market may dismiss such exercises but there’s a reason why the price has pulled up here and didn’t anywhere else in the last 350 odd pips, and that’s why real traders look closely at the charts and don’t just jump in willy nilly. The guys here at ForexFlow all identified this as a possible stall point and traded it accordingly. But, this doesn’t mean we’ve picked a bottom. What we have is a place where the sellers have run into bigger headwinds than more recently, and where buyers have decided to make a stand. That battle is still ongoing so as usual, we trade what we see and we plan accordingly.
For me, my caution about taking longs here increases the longer we stay down or keep coming back to this area. As traders, we cannot just pick lines and blindly trade them while ignoring the price action. I didn;t get into any of my chosen buy levels last week becasue of my caution, and because of where my entries were. It was close but not close enough. So, the fact that bounces have been limited is a concern. It’s a sign that sellers are still pushing back on rallies. A look at the H1 chart tells the story perfectly.

NZDUSD H1 chart
The fact rallies are currently capped to the 0.7090/95 level is very definitive of sellers remaining strong. In one sense I would have liked my analysis to have been proved right, (just for confidence sake) by seeing a bounce up to at least a test of the 38.2 fib of the recent drop. That would do two jobs. One, show that we now had a reasonable bottom to look at, and two, that the short-term trend was looking to refresh. Holding the 38.2 would have possibly given sellers another chance to push it down again. Instead, the fact that the bounce so far has been very limited suggests that we’re not out the woods just yet and another attempt at the lows is likely. While I still like the tech down here, this evidence now tells me to be more cautious about taking longs against it. While I’m happy to look at longs again here, I’m going to use what I now know to lower my risk and trade smaller size than I was looking at last week. I’m currently bid small at 0.7045 (filled as I type) and 0.7040 and will stop half of it on a break of 0.7020, then add back in as close to 0.7000 as possible, to play the big figger. A break of 0.7000 will likely give sellers another reason to give it another big shove so I’ll have a tight stop under there. If I get any further signals that the trade is looking dodgy, I’ll pack it all in and re-assess it all. For the upside, I’ll be watching tests up near 0.7090/95 closely but will look to lock in some profits as early as possible in my usual way.
As traders, every day is about going on a fact finding mission. We have to ask questions about the price action and question our own strategies day by day and minute by minute, if necessary. We have to ask if something has changed or if the price action telling us something new. If you can get this analysis right while you trade it can help you lower your losses and maximise your profits. You should always take an objective view your positions and strategies and look at what can go wrong and not what can go right.
So, the NZDUSD story continues and I wonder what will happen in chapter 3.

Philosophy: “Don’t be a Dick for a tick”
Read how Ryan got into trading here
- The last NFP competition of 2022 - December 1, 2022
- Will this month’s US NFP be a horror show? - October 4, 2022
- US NFP competition – Do you think there’s going to be a turn in the US jobs market? - August 31, 2022
Like it. Usd buying has resumed but not quite a strongly as last week. There are some big levels looming in the down unders and they could hold or break. I like the idea of trading the breaks on both v Usd and viceversa
A sound play Chef. Good luck sir.
Kiwi would be more resilient than Aussie when USD is getting stronger at the time being, and AUDNZD is approaching a spot worth trying a short, I placed a limit order at 1.072 , which may also hedge a little bit risk of my NZDUSD long position.
One of of our other readers highlighted the 1.0710/20 area too, so you’re in good company Chen.
Good to know someone else beside H and me also trades this boring pair:-)
It’s the antipodean EURGBP 😀